BTS
A behind-the-scenes look into our long-form stories, events, and all the fun stuff we get up to!
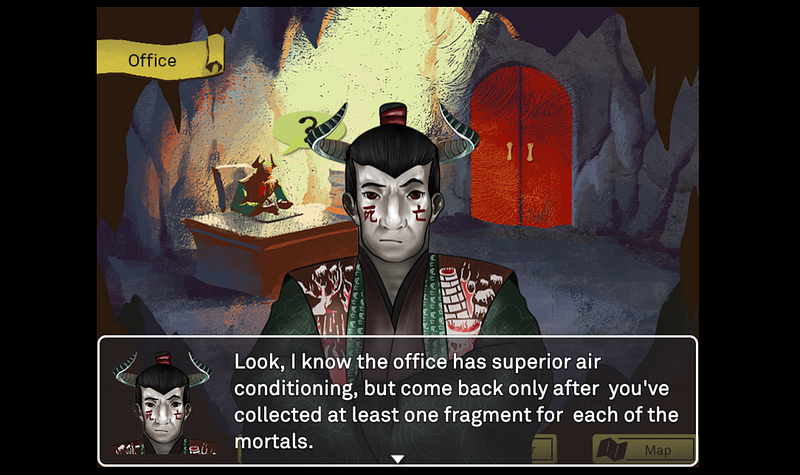
Eighteen levels of hell (Part II): Writing and designing
Embracing uncertainty and life’s surprises is a large part of growing up. Even then, making a game about hell two months out of university…
Eighteen levels of hell (Part I): Conceptualising our game
Kontinentalist created our first-ever narrative game, Hell’s Apprentice, based on the Buddhist-Taoist folklore of the eighteen levels of…
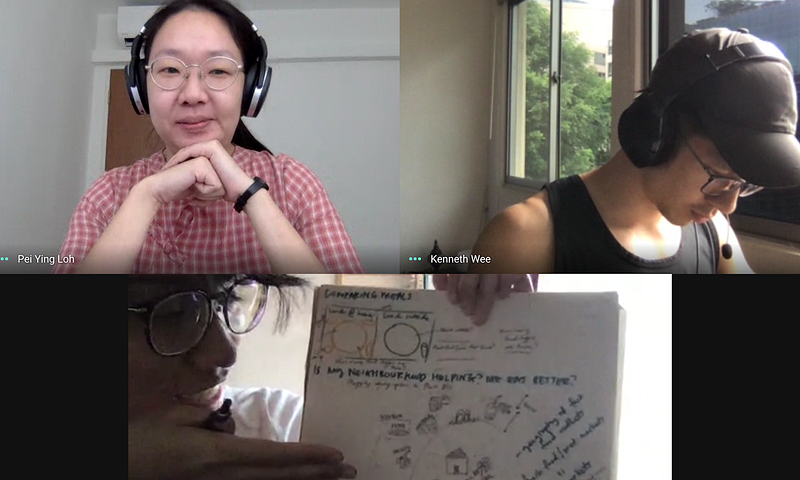
Conducting a virtual data storytelling and visualisation workshop
With a bonus peek into our writers’ dietary habits.
Thoughts on Making the Migratory Bird Map
One of my work goals of 2020 is to work with Mapbox GL JS and Scrollama JS to create a decent scrolly-driven map. Born to fly: The life…
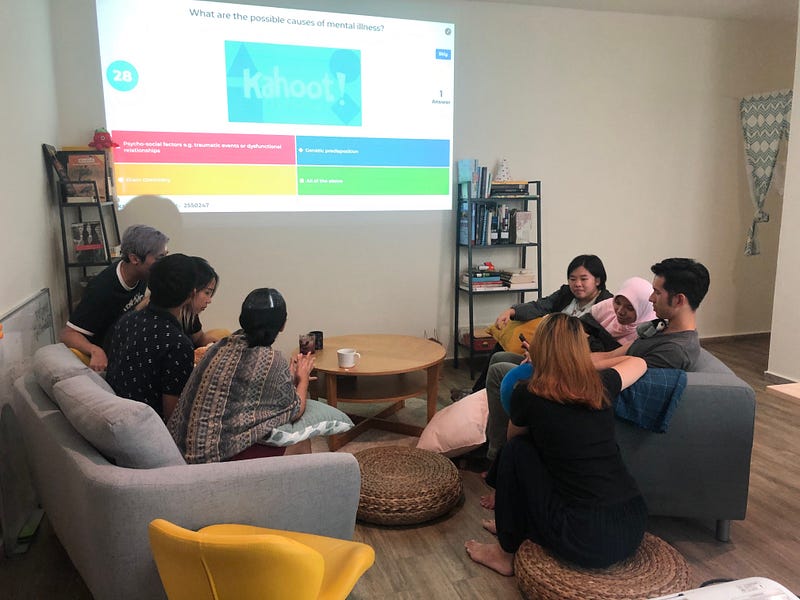
Let’s talk about mental health!
Editor’s note: This roundtable was organised by our former intern, Zu Xiang, in January 2020, before the Circuit Breaker was implemented…
Coding a Konti Story
In my 8 months of working with Konti as a front-end web-developer, I’d worked on 5 hard-coded stories, and a handful of auxiliary data viz…
COVID-19: Konti’s work-from-home experience
By now, you may have seen the phrase ‘flatten the curve’ floating around the Internet.
How to market a Kontinentalist Story
Our thought process behind marketing stories rich with data visualisations.
Musings of a history major in the field of data visualisation
“Oh, study history. Next time you’ll be a teacher, right?”
Kontinentalist’s 2020 New Year’s Resolution, Secret Santa style
Christmas ended last month, but we’re not quite ready to say goodbye yet. That’s why we did our New Year’s Resolution in a Secret Santa…
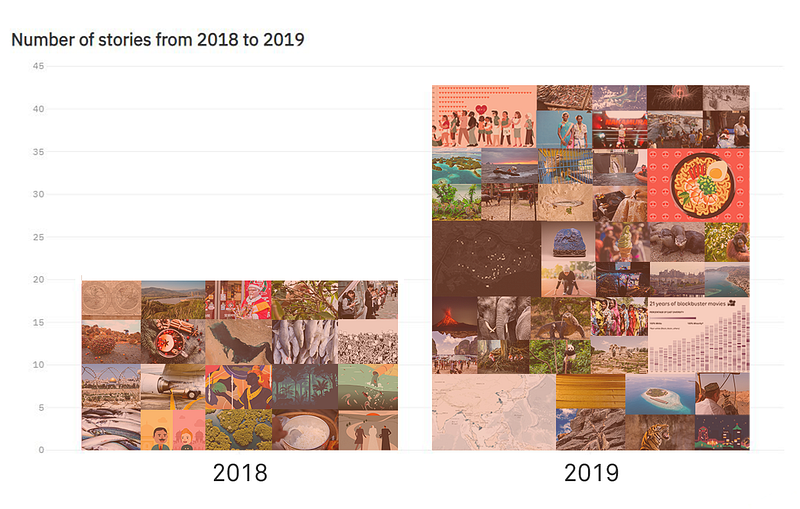
Konti in retrospect 2019
We started 2019 by mapping out our resolutions for the year (both personal and professional). The year flew by and we grew so much as a…
A day in the life of a programmer at a startup
Hi, I’m Dylan, the lead developer at Kontinentalist. So as a developer, people often think that my work entails sitting in front of my computer all day, with 1s and 0s filling my screen. They are wrong. I have three screens! 😉 Today, I’ll walk you through a typical


