Coding a Konti Story
In my 8 months of working with Konti as a front-end web-developer, I’d worked on 5 hard-coded stories, and a handful of auxiliary data viz…
In my eight months of working with Kontinentalist as a front-end web developer, I’ve worked on five hard-coded stories and a handful of auxiliary data vis for other normal scroll stories. This roughly equates to one and a half months of work to produce a hard-coded story from conception to end.
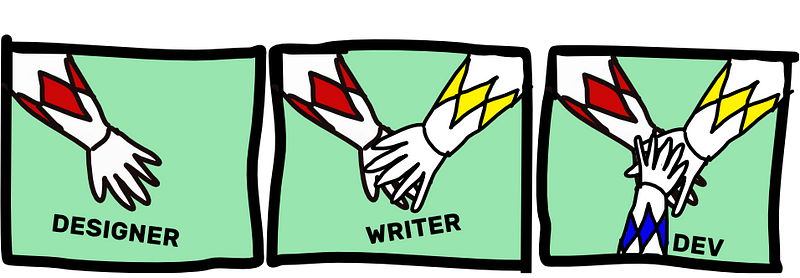
For that reason, I’ve settled into a comfortable routine when it comes to bringing a Konti story to life. Since we tell visual stories, I’ll be using graphics and annotations to talk you through my process.
A Konti story is data-driven. To put it plainly, this means that there is some kind of data visualisation between chunks of paragraphs in a story. These visualisations may be static or interactive, and they may take the form of a chart, map, infographic, and so on.
Step 1: Concept meeting
By the time the baton reaches me, the story has been pitched, and some form of data has been collected by the writer. The writer would also have an idea of how the story will flow and thought of some visualisations for the story.
At this point, my main concern is how the data structure looks like. Are the variables categorical or continuous? Are we working with a time series? Is the vis going to be interactive or static?