Konti in retrospect 2019
We started 2019 by mapping out our resolutions for the year (both personal and professional). The year flew by and we grew so much as a…
We started 2019 by mapping out our resolutions for the year (both personal and professional). The year flew by and we grew so much as a company! We conducted our first-ever design sprint, published 43 stories to date, worked on some exciting partnerships, and entered a data vis competition (we came in third, yay!🏅).
To wrap up this year, we’re reflecting on 2019 in the best way we know how: letting the data tell the story!
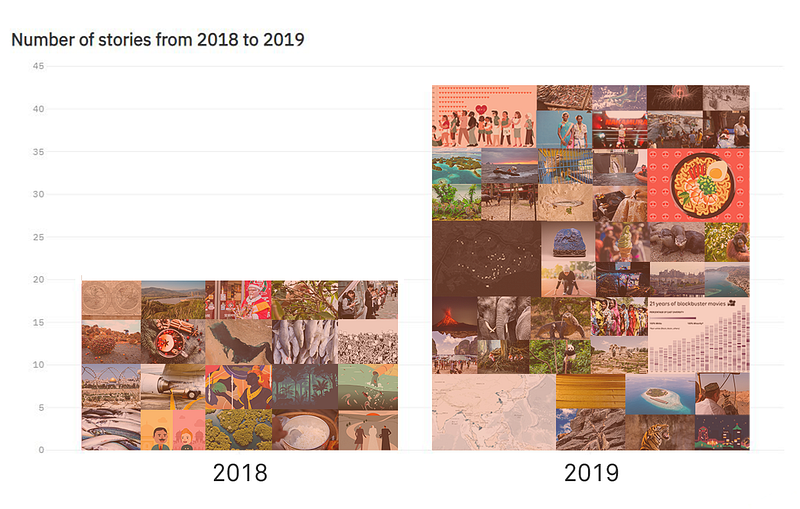
First up, we looked at quantity. We produced more stories this year than in 2018 (and rightly so — considering it was one of our company-wide goals for 2019!). We had a steadier editorial calendar, aiming to publish a minimum of three stories per month, and with a greater variety. We also attempted more technically challenging stories, such as our stories on ghosts and rising sea levels in Asia.
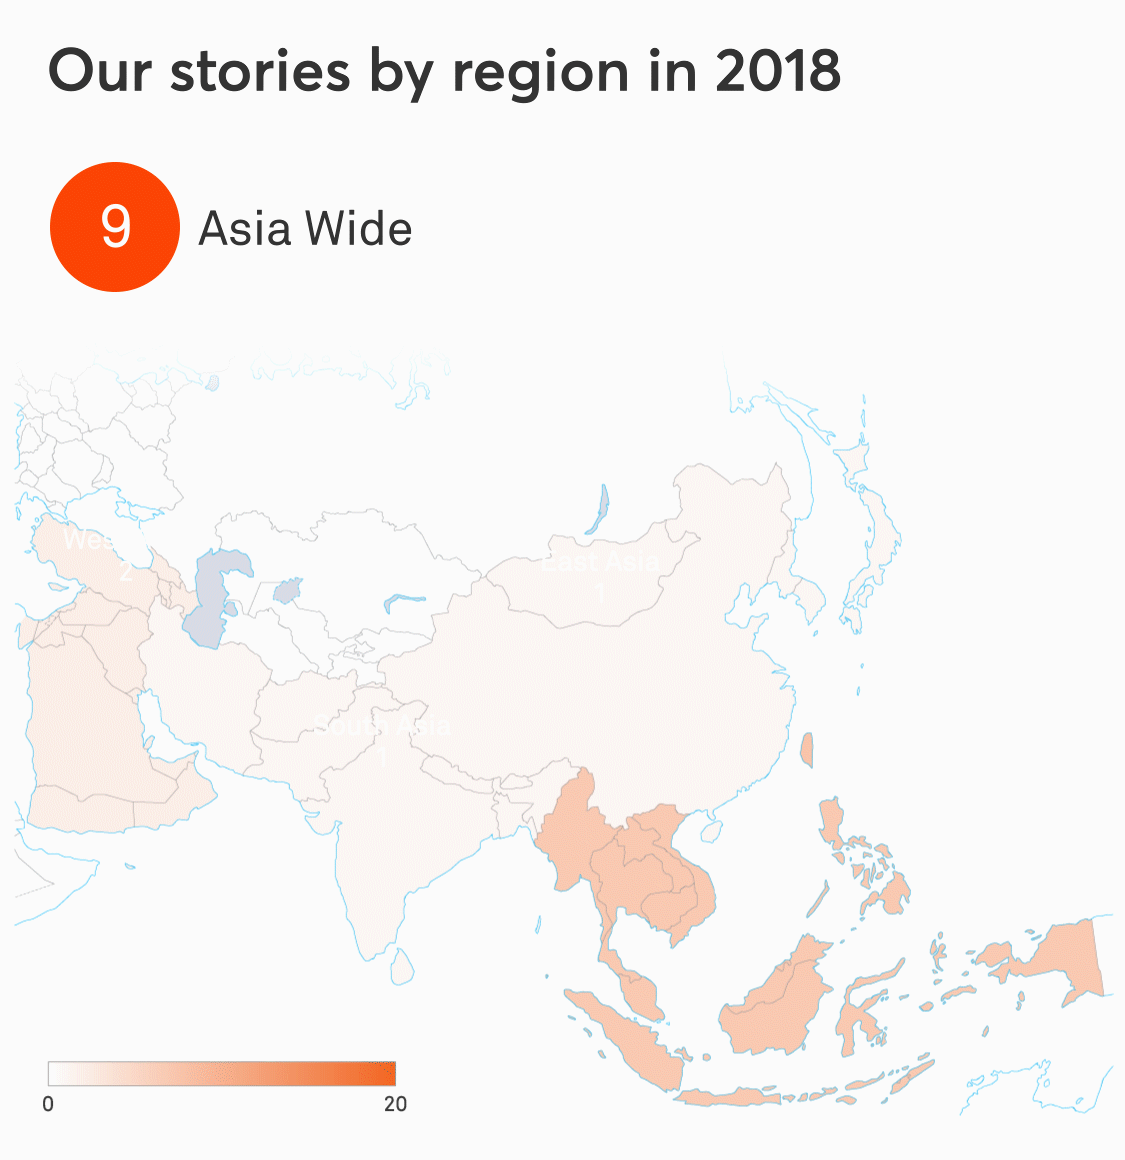
This year, our regional focus also grew. As you can see in our gif above, we expanded our Asia-wide lens while staying true to our Southeast Asia roots.