BTS
A behind-the-scenes look into our long-form stories, events, and all the fun stuff we get up to!
We abandoned Wordpress to build our own CMS
Let Dylan and Rifqi, our Lead Developer and Full-stack Web Developer, tell you why. Abandon ship! To answer why, let us travel back in time to when Konti started, as Peiying mentioned in her article on our rebranding. In the early days of 2017–2018, most of what we did
Kontinentalist: A fresh new look, and why we rebranded
We’ve given Kontinentalist a makeover!! Gone are the beige-brown days, and here are the purples, oranges, and pinks.
Rebranding notes from the equator (Part 2: Design)
Hello again! In this second post about our rebranding of notes for the equator, our visual designer Munirah spills the tea about…
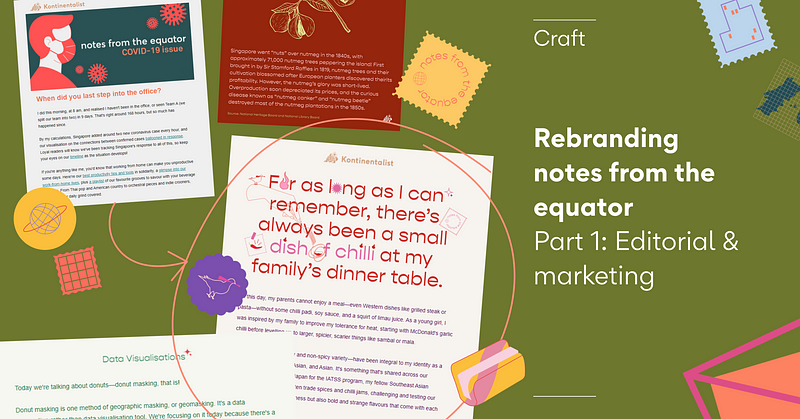
Rebranding notes from the equator (Part 1: Editorial and marketing)
Hello! We (Bella and Griselda) will be talking about the rebranding of our newsletter, notes from the equator, in two parts here in this…
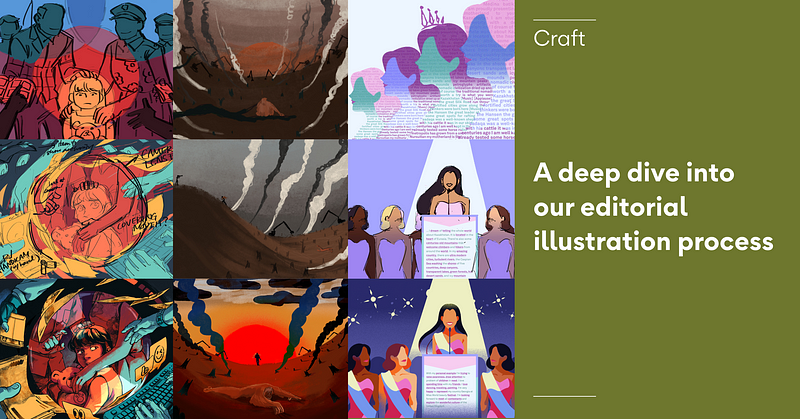
A deep dive into our editorial illustration process
Let me share with you how we came up with our editorial illustration direction and workflow — and what we learned along the way.
Answering students’ questions about data storytelling—an inexhaustive guide
Last month, Mick and I had the great fortune of conducting office hours for students from the University of Applied Sciences Amsterdam…
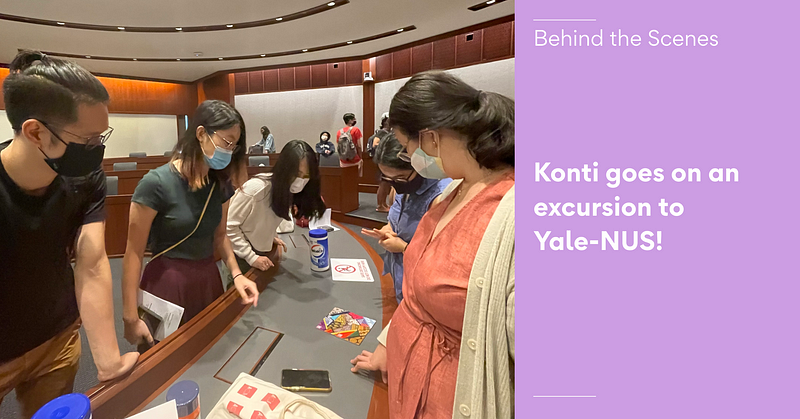
Konti goes on an excursion to Yale-NUS!
Our mission? To coach Yale-NUS students to tell the best data story they can in a data competition!
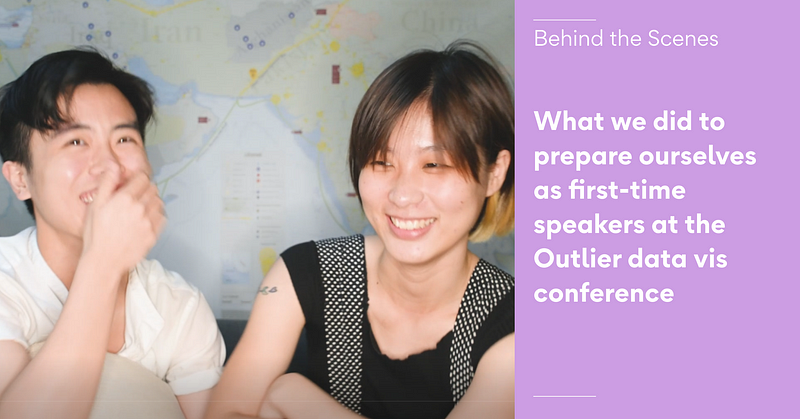
What we did to prepare ourselves as first-time speakers at the Outlier data vis conference
Outlier was a much-celebrated online conference by the Data Visualization Society (DVS) that took place from 4–8 February 2021
Filling our tummies and enriching our minds at Spice Zi
When you create something, the reaction to your creation is often hard to anticipate. Upon release of our story on chilli sauces in Asia…
Our favourite projects of 2020
We made it! What better time to reflect and give thanks to the end of this dastardly year than to look back at some of our favourite…
Creating my first data vis story: a process
In which I detail my experience with my first data vis story on spicy food in Asia and hope it helps someone else in a similar place.
Part III: Everything visual about the eighteen levels of hell
A few weeks ago, the Kontinentalist team published our narrative-based game, Hell’s Apprentice, based on the Buddhist-Taoist folklore of…


