
Hey! 👋
Welcome to Kawan—our vibrant community of data heads and storytellers. We’re all about improving data literacy and sharing nuanced stories about Asia. Come hang!

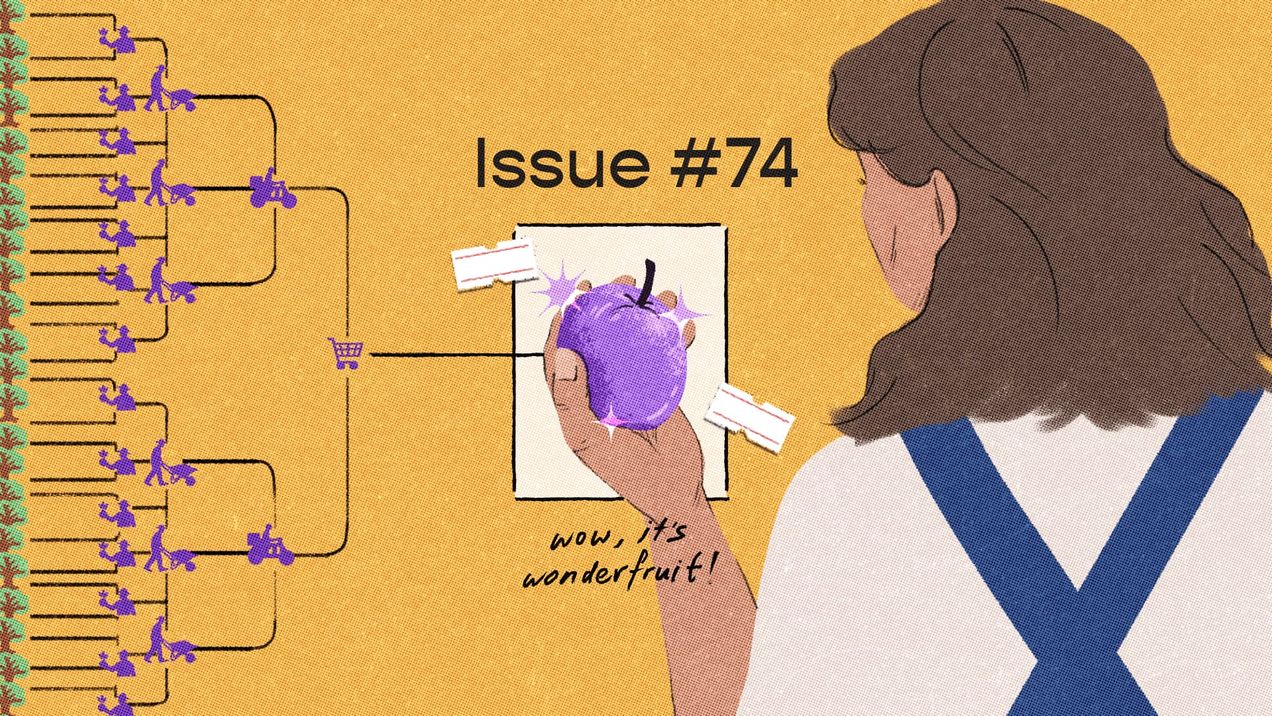
Pluck, pluck, pluck — issue #74
What would you do if you discovered a new resource growing in abundance on your land? What if it comes with a cost? Human behaviour is age-old, and we seem bound to repeat the choices that have echoed throughout history. We ponder access, utility, and the secret calculations we make every day.
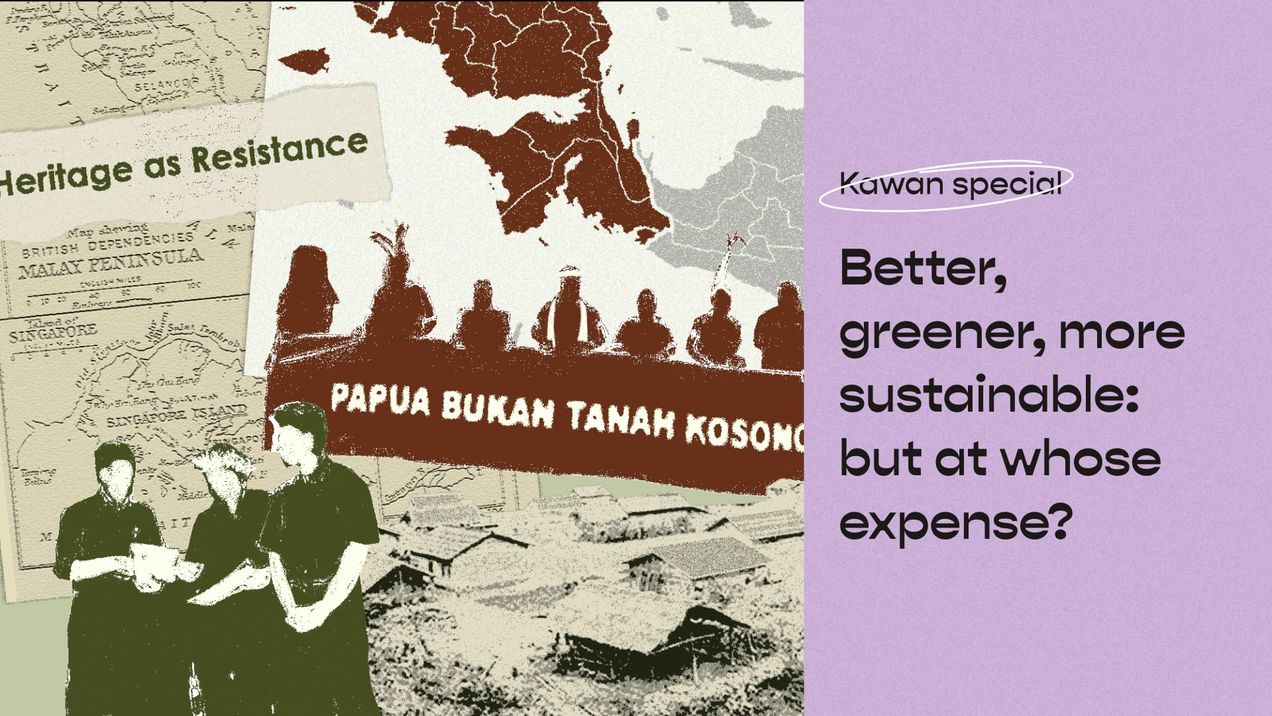
Better, greener, more sustainable: But at whose expense?
We all want a better, greener, and more sustainable future, we also want abundance in agriculture, food production, and natural conservation. But adding the decolonial lens forces us to ask: At whose expense is this better, greener, more sustainable development made possible?
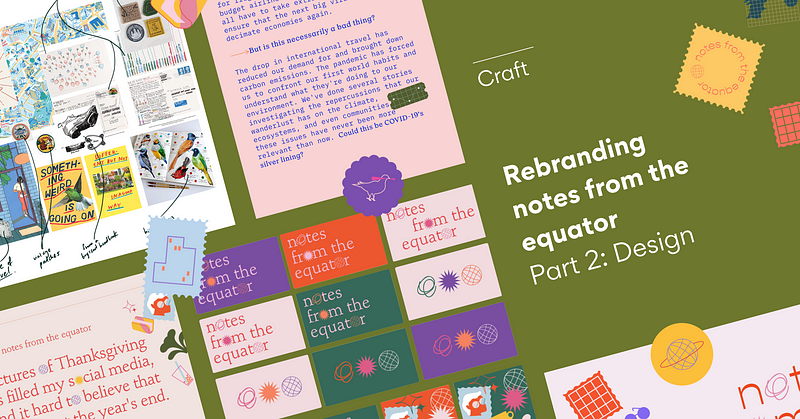
Rebranding notes from the equator (Part 2: Design)
Hello again! In this second post about our rebranding of notes for the equator, our visual designer Munirah spills the tea about…
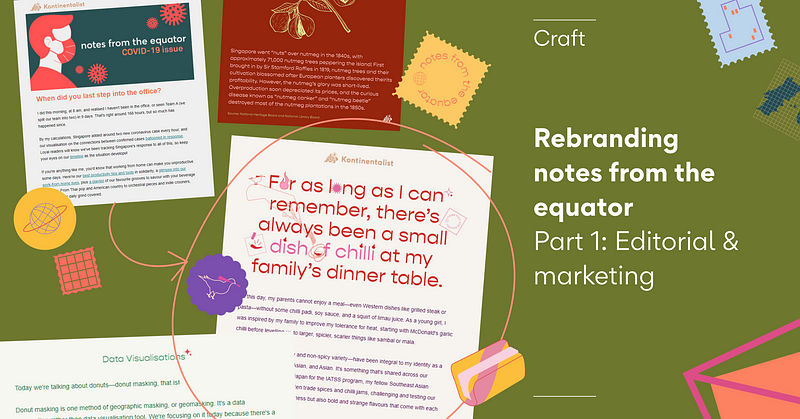
Rebranding notes from the equator (Part 1: Editorial and marketing)
Hello! We (Bella and Griselda) will be talking about the rebranding of our newsletter, notes from the equator, in two parts here in this…

Meet the Community! Harim Jung, data viz expert and nuclear engineer
Harim is a Korean nuclear engineer by training who has worked in Abu Dhabi. She learned data visualization on her own and is an avid…

Our spiciest issue yet — issue #23
Till this day, my parents cannot enjoy a meal—even Western dishes like grilled steak or pasta—without some chilli padi, soy sauce, and a squirt of limau juice. As a young girl, I was inspired by my family to improve my tolerance for heat, starting with McDonald's
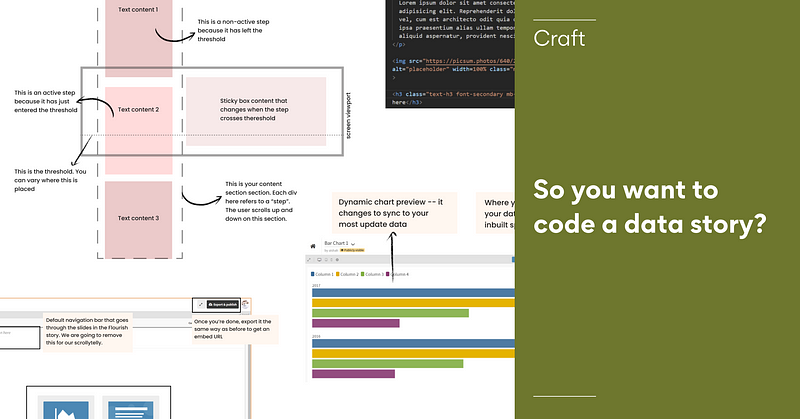
So you want to code a data story?
“So you want to be a web developer?” “Yeah! I wish I could make stuff like this too!”

Meet the Community! Ri Liu, data viz designer/developer
Ri graduated from Queensland University of Technology with a degree in Communications Design/Creative Industries/IT. She worked as a…
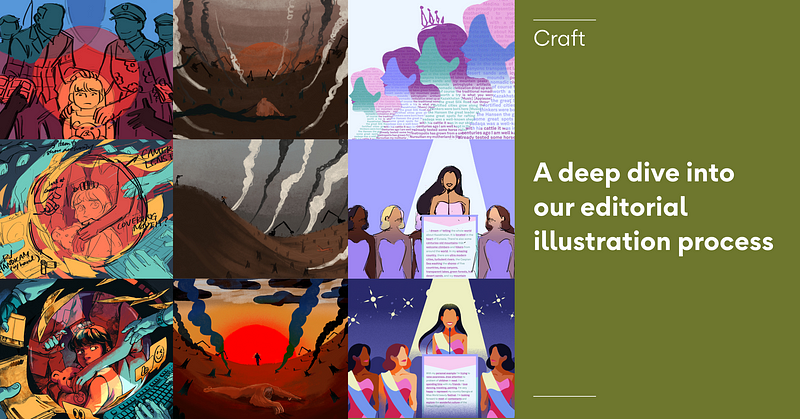
A deep dive into our editorial illustration process
Let me share with you how we came up with our editorial illustration direction and workflow — and what we learned along the way.
Asia's majestic forests — issue #22
Two years ago, I managed to catch The Great Animal Orchestra, an exhibition of animal recordings captured in the wild by bioacoustician Bernie Krause. In a pitch black room, the bright bars of a spectrogram flashed on the walls, freezing each species' cries in the forest. It was a
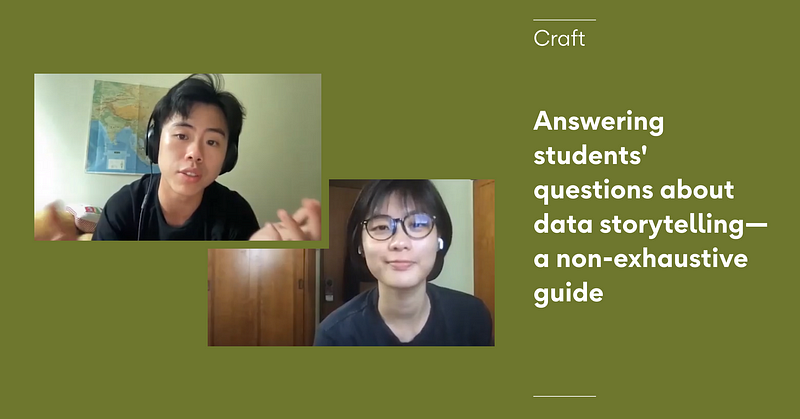
Answering students’ questions about data storytelling—an inexhaustive guide
Last month, Mick and I had the great fortune of conducting office hours for students from the University of Applied Sciences Amsterdam…

Meet the Community! Catherine Ma, Communications PhD student at University of Miami
We’re excited to bring you our first interview of our Community initiative! Launched in late February, we’ve been hungrily scouring the…
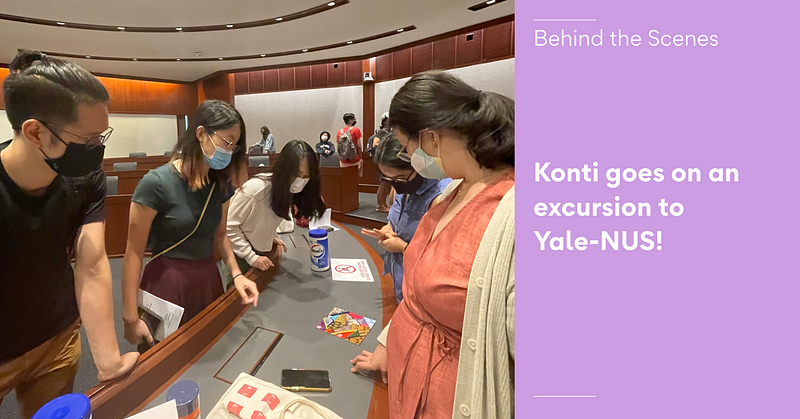
Konti goes on an excursion to Yale-NUS!
Our mission? To coach Yale-NUS students to tell the best data story they can in a data competition!
A country of immigrants — issue #21
The history of humankind is one of migration. We only ever leave our homes in search of a better life elsewhere, and that has been the force moving human beings out of Africa and into human settlements all across the world. We all seek the same things in new lands—