
Data Diaries
First-hand data tips, tools, and a peek into our thoughts on the craft of data storytelling and visualisation.
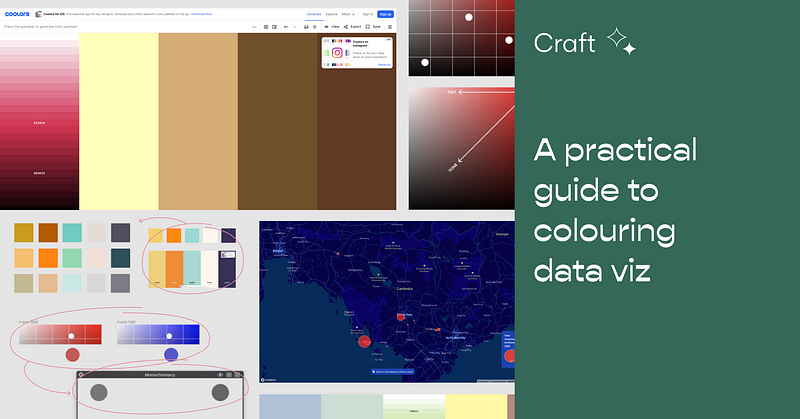
A practical guide to colouring data viz
There are lots of resources out there explaining things like colour theory, but knowing the theory and executing are 2 very different…
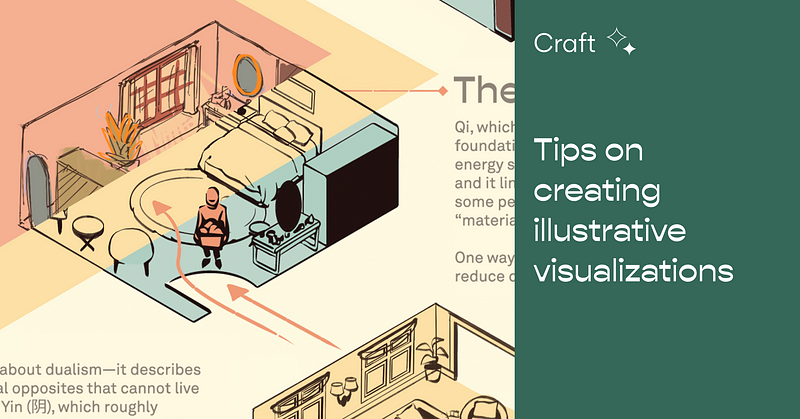
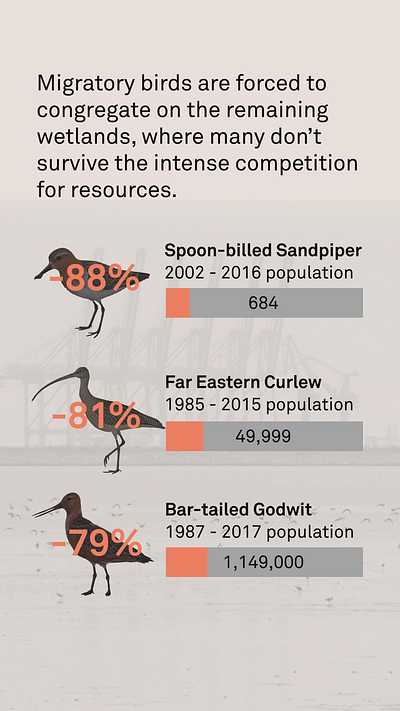
Tips on creating illustrative visualizations
We produce many cultural data stories at Kontinentalist. As such, we may take a more illustrative approach for various reasons, such as…

Tips on staying sharp as a developer
Programming is not a stagnant discipline. Being a developer—in my case, a full-stack developer—means you’re always learning to keep up with…
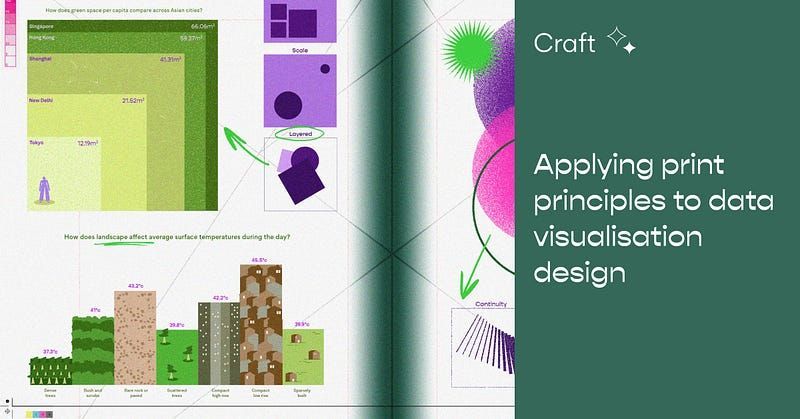
Applying print principles to data visualization design
How can data viz design benefit from design theories like the Gestalt principles?
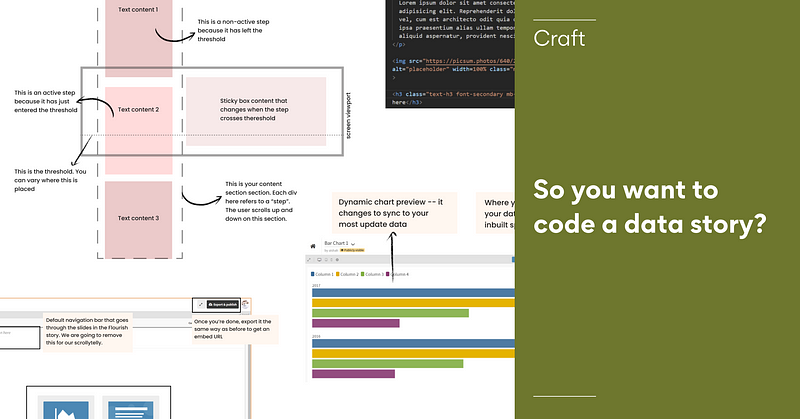
So you want to code a data story?
“So you want to be a web developer?” “Yeah! I wish I could make stuff like this too!”
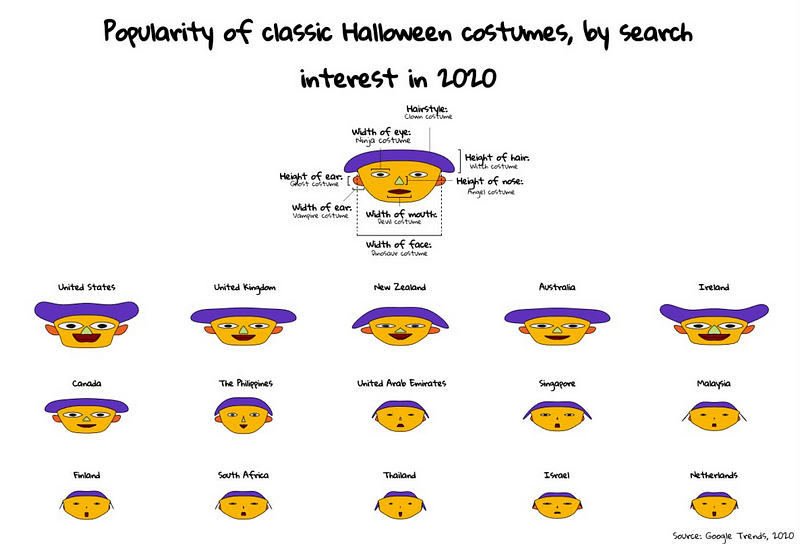
How can a data visualisation be racist?
Halloween fell on a rainy Saturday this year, and I was feeling restless and bored. But instead of doomscrolling through Twitter and…
How COVID-19 has changed the data storytelling landscape
We’re at the midway point of 2020 and, quite unbelievably, the world has been brought to its knees by the invisible yet pervasive COVID-19…
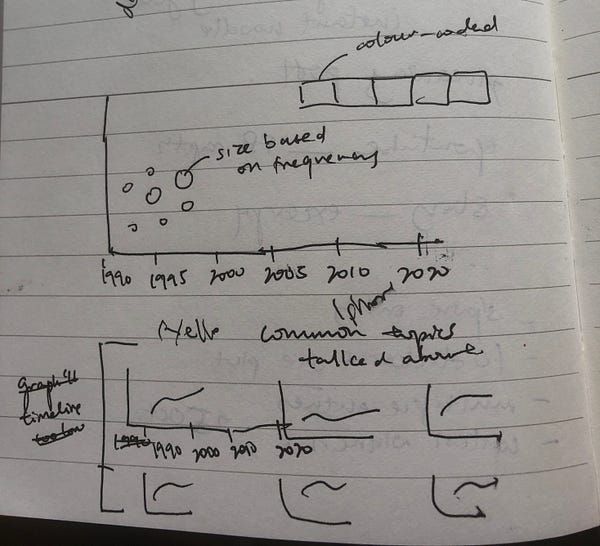
Designing data visualisations for social media
As Kontinentalist’s Multimedia Designer, one of the things I’m in charge of is creating social media assets as teasers for our stories…
How I write data-driven stories
I’ve been a writer for almost two years now at Kontinentalist, a data-driven editorial studio in Singapore. In that time, I’ve interviewed…
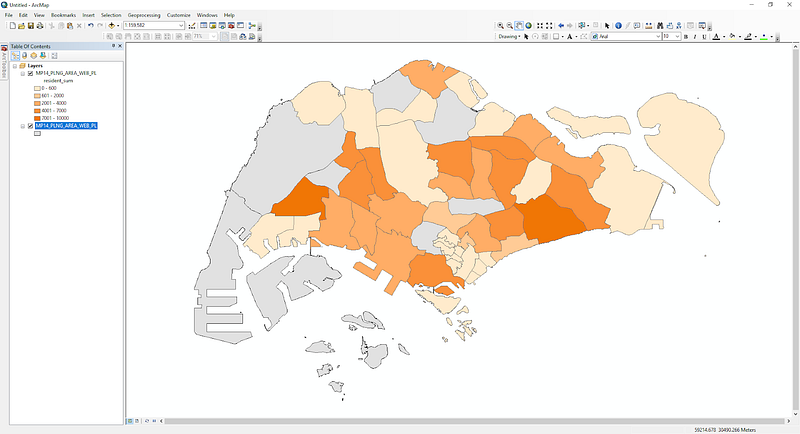
A quick guide to ArcGIS — how do we begin?
What is GIS?

5 tips for better writing
The first thing that must be understood about writing, is that anyone and everyone can write. The key question is: how do we write well?
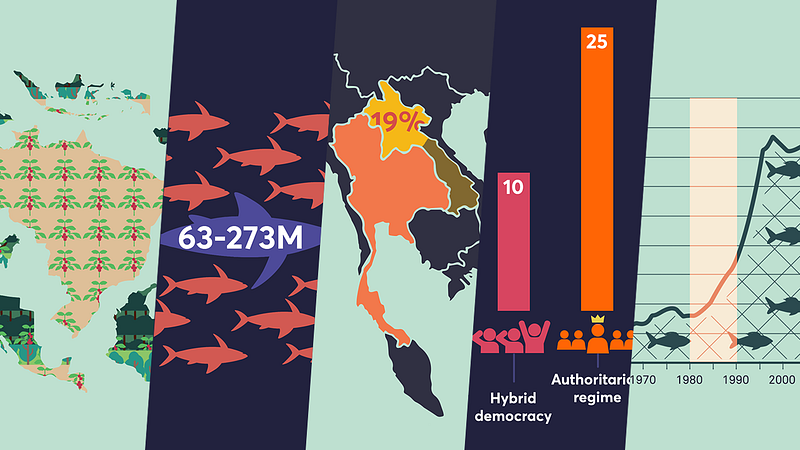
Kontinentalist’s Favourite Statistics 2018
This World Statistics Day, we asked our editorial team for their favourite statistics that they have come across whilst writing or…