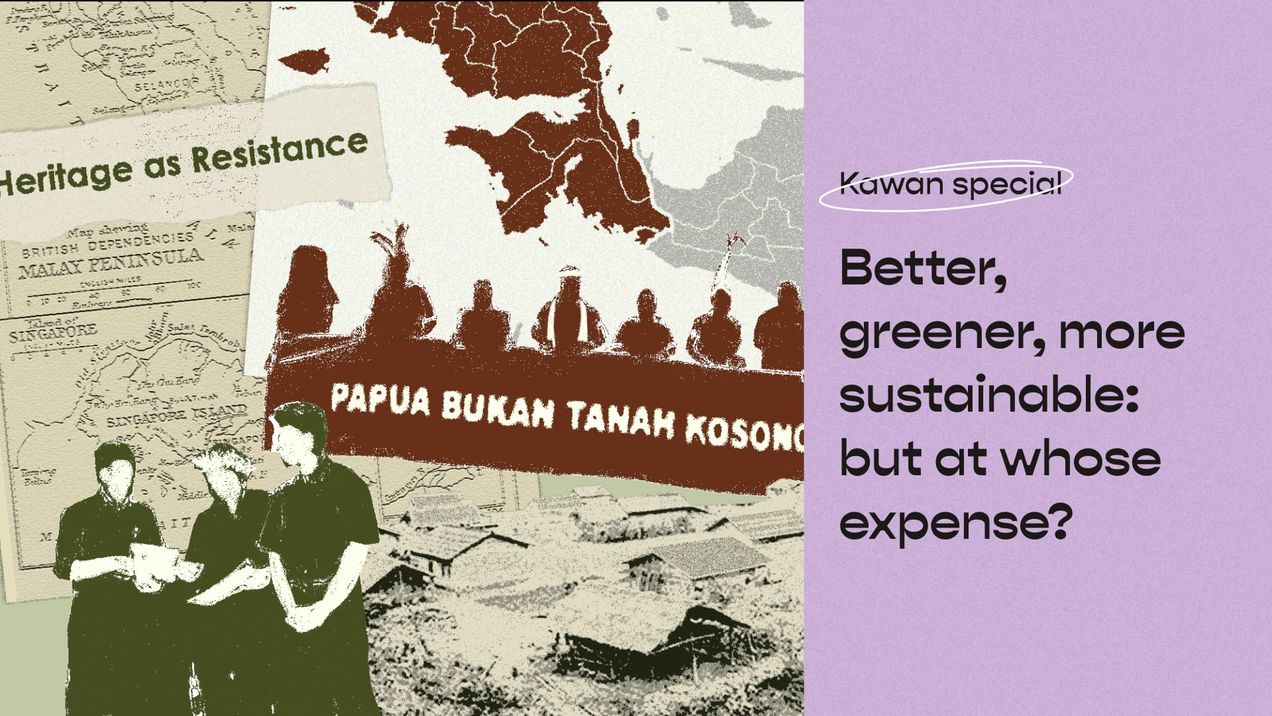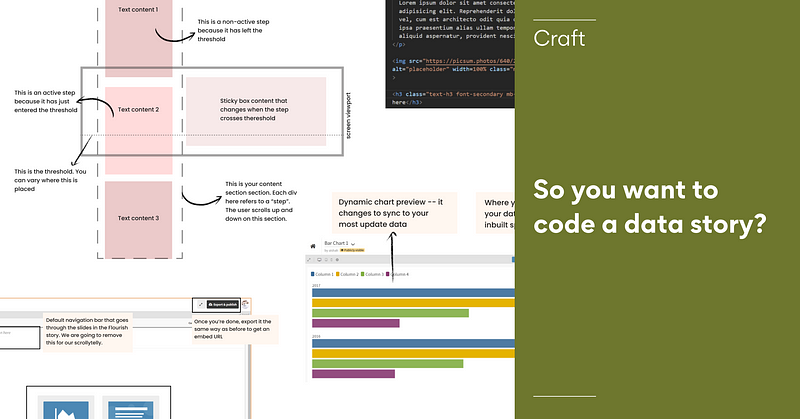
So you want to code a data story?
“So you want to be a web developer?” “Yeah! I wish I could make stuff like this too!”
“So you want to be a web developer?”
“Yeah! I wish I could make stuff like this too!”
How I got to now: A condensed version
It was two years ago, and I was in my final semester of my MSc. Urban Sciences. I stumbled upon Konti’s most-famed baby: the Belt and Road story, which features maps and a seamless scrollytelly experience. That catapulted me into the dataviz rabbit hole which I never came out of.
As a result of religiously poring over works by The Pudding, The Upshot and Reuters Graphics, I’d decided that I, too, wanted to make a data story — dataviz with story text. Recklessly, I’d told my final-year project mentor that my deliverable would be a data story built with D3.js (D3 was all the rage in the dataviz circles). “Reckless” because I was going head-first without any idea of how to write a data story — and make it into a webpage within four months? Good luck, past-Aishah.
It worked out in the end, though; I got an “A” and didn’t become an urban planner.
This is the first story in a series where I take you through how I code a data story at Konti. If you’ve been sitting on that dataviz project, this is your sign to push through! I’m living proof that coding dataviz does get easier! :)
So get a pen and your laptop, and follow my tutorial on making two formats of our datastories: Chronicle and scrollytelling.