
Where to begin? My guide to pitching a data story
I’ll be honest — three years in the field of storytelling/journalism has not made me much more confident about pitching stories than when…
I’ll be honest — three years in the field of storytelling/journalism has not made me much more confident about pitching stories than when I first started.
While my mind is often buzzing with new story ideas and inspiration, I am the type of person who is extremely cautious of putting my ideas out there and often second-guess my ability to execute and do justice to the topics that I care about. I’ve also gotten a fair share of rejection when I used to pitch stories as an intern and a freelancer.
But, rejection is normal for any of us in this industry, even if you have several years of experience under your belt. This trains a writer to seek novel story ideas and craft sharper pitches that are backed up with research.
Pitching can also be the least challenging and most invigorating part of the whole storytelling process. It does get easier to bust out a pitch the more you do it. It’s when I feel most excited, and where grand visions of the story begin to materialise in my head. It is important for any writer to know what makes a good pitch and the steps needed to get there. Luckily, Kontinentalist has a standard pitch format that breaks the process down for its writers and allows us to communicate clearly what our story is about.
For freelancers keen on pitching to us or other media publications, the way we do it at Kontinentalist sets a good foundation for streamlining ideas and crafting your own pitches for other publications, even if they are not data-centric. I hope this serves as a helpful guide on what works and what doesn’t!
How to pitch?
- Pick a story idea and run with it
Since we focus on data-driven stories, having a good dataset or the potential to access credible, substantial data on a specific topic is an obvious starting point. Without sufficient data, a pitch for Kontinentalist will not fly — or the story might just fall apart.
This has happened to me on multiple occasions, and I’ve either had to shelve the whole story or change the angle in order to fit other data in. This amounts to wasted time or a lot of extra work, so it’s best to have a good dataset or two from the get-go.
When I can’t find a good dataset or simply run out of story ideas, I often turn to the news and other material I’m currently consuming, such as books, music, or art. While we don’t chase news cycles at Kontinentalist, news headlines and Twitter trends can inspire new angles for looking at a particular issue that people might overlook, or that the mainstream discourse has drowned out. Having an Asian perspective on current affairs or the state of a particular industry or phenomenon is often unique in itself, and if you can back it up with sufficient research and relevant data, great!
Uniquely Asian stories are what we value at Kontinentalist. As our editor Kenneth says, successful pitches should offer an interesting angle that tells him something new about Asia he might not have thought of.
In a recent story I did on heat inequality in Asia, I looked into how the uneven distribution of greenery leaves underprivileged communities more vulnerable to the effects of urban heat. Many studies have exposed the effects of redlining, and the New York Times has reported extensively on things have gotten worse with global warming. But most of these reports are based in the United States. I wanted to find out whether this inequality existed in Asia (it does), which is what I went about investigating.
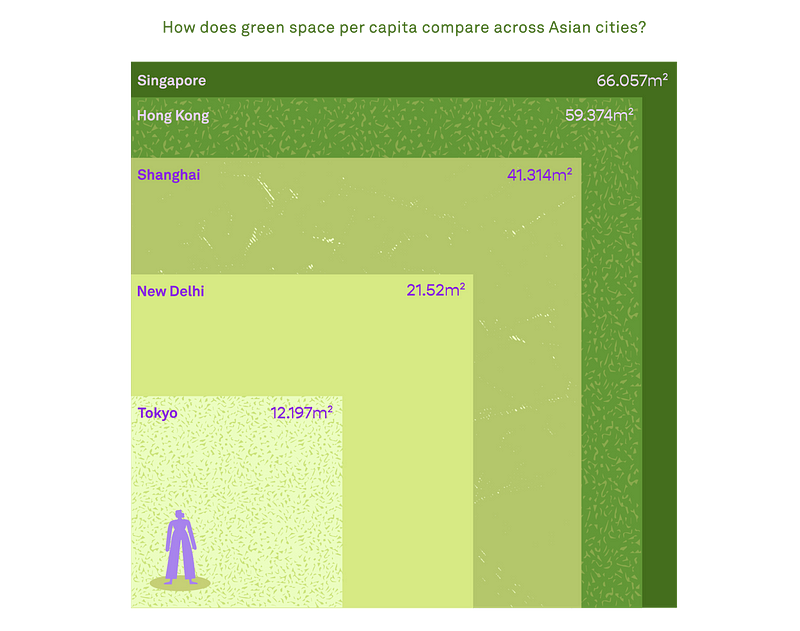
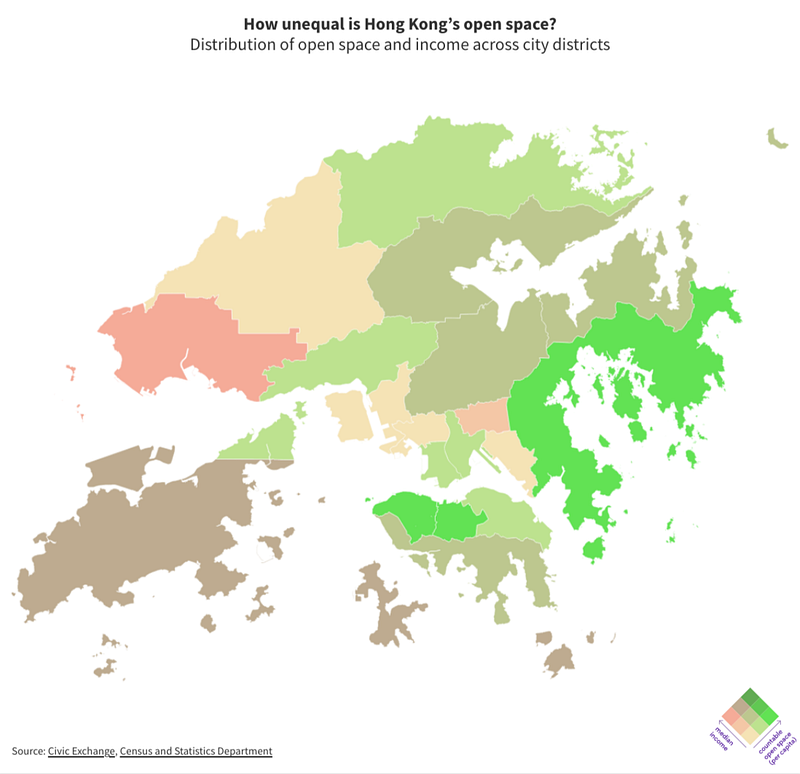
Our designer Munirah designed this box viz to show how green space per person differs across Asia’s cities, while our intern Zenn mapped income across the availability of open space in Hong Kong.
The things we are drawn to in everyday life are also telling of what we care about and are willing to look deeper into. “A sarong’s story: Reclaiming Asia’s versatile cloth” was exactly that kind of story. I worked with our designer Munirah to explore the history of the sarong in Asia and how it has been used as both a tool of women’s oppression and liberation.
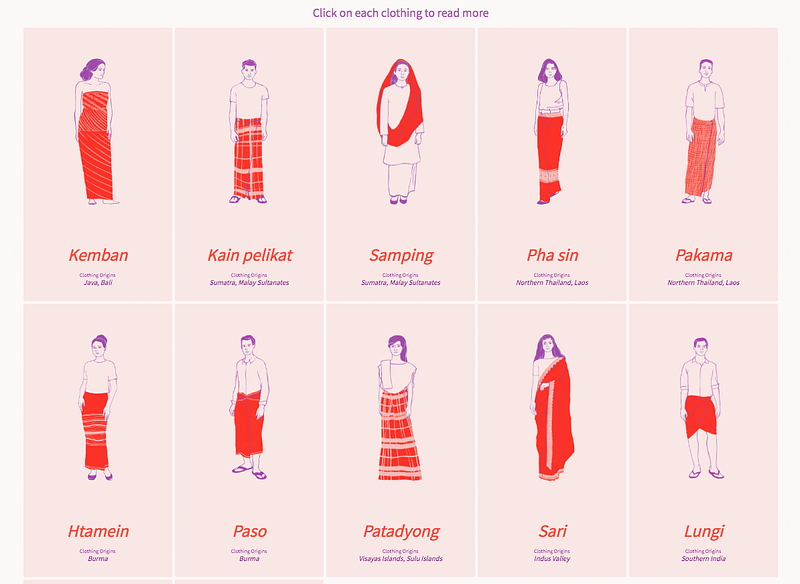
Munirah illustrated the different sarong variations that exist in Asia.
2. Come up with key questions
After getting an idea of what you want to write about, ask yourself, What are the questions your story attempts to answer? Does it meet a gap in conversation of the issue? How does your data challenge existing assumptions of Asia?
This gives the editors a clearer idea of what your story is about and why it’s one that hasn’t been told before. This also comes in handy when you are organising your research and crafting your story outline.
For my story on poverty in Asia, I challenged the widely accepted notion that the region has been successful in eradicating poverty. I wanted to find out whether the international poverty line of US$1.90 is still a relevant benchmark for poverty.
These simple questions were in my pitch:
- How much progress has Asia made in eradicating poverty?
- What are some issues with the international poverty line?
- Are there better ways of measuring poverty?
- What can one buy with US$1.90?
I chose to answer the last one with an illustrated viz of basic goods in two cities: Manila and Singapore.
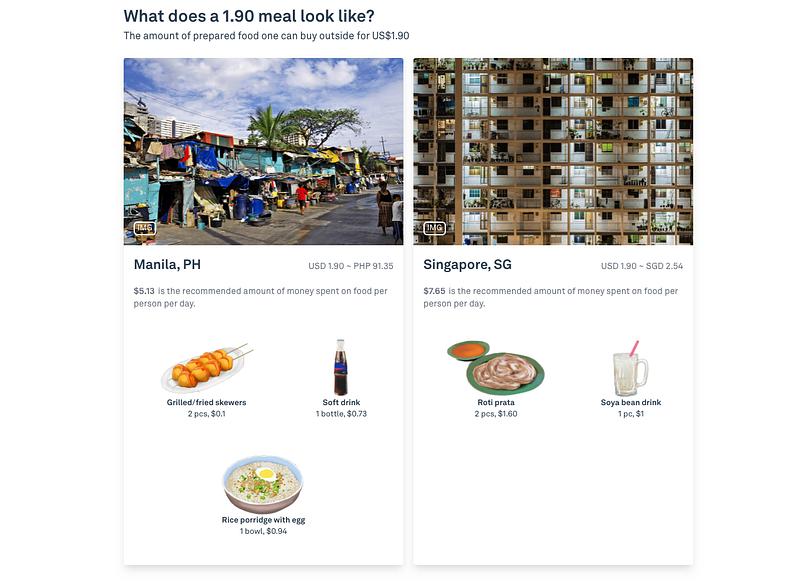
Bianchi and I searched for the prices of basic food items in Manila and Singapore and compared them on the basis of meeting the US$1.90 poverty line.
3. List your key sources
Many of my stories revolve around human rights and social justice, which makes my job a tad easier, because a lot of international organisations and non-profits provide open-source data on these issues. Many NGOs are also open to sharing their data with you if you reach out with a relevant story idea in mind.
Providing your main sources of research and data assures the editor whom you’re pitching to that you have sufficient and credible information to hold up your story and add meaningful substance.
In my story on sex trafficking in Asia, we used data from the Counter-Trafficking Data Collaborative, the Global Slavery Index and the Women, Peace and Security Index. We also manually collected data from news articles and reports to visualise how the issue has been reported on, as well as the main players involved in a trafficking network.
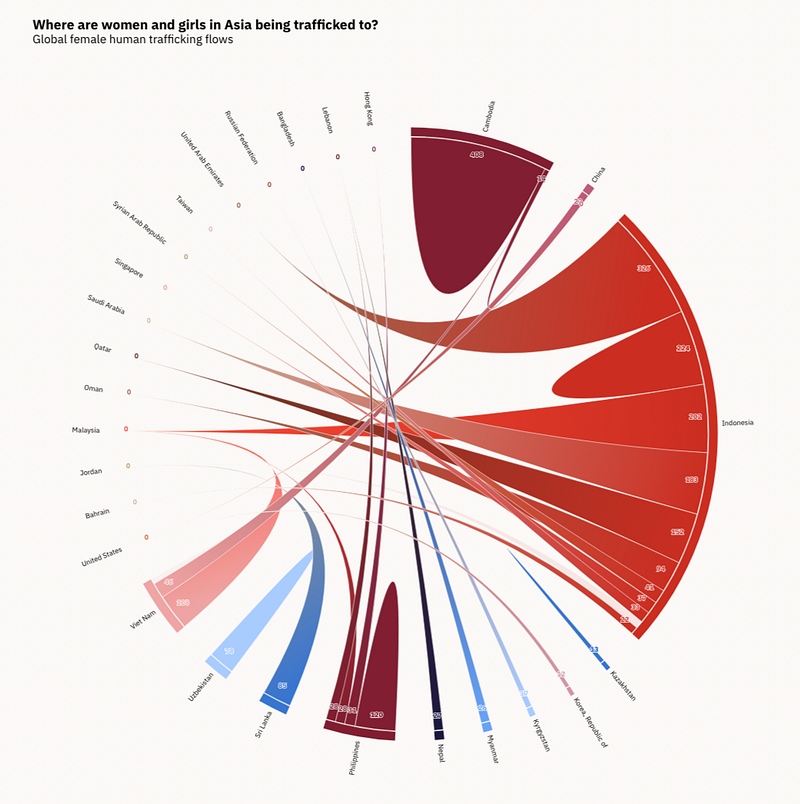
Bianchi extracted and analysed data from the Counter-Trafficking Data Collaborative’s Global Dataset to visualise sex trafficking flows in the region.
4. Describe your methodology
While your methodology might change along the way, it helps to add a sentence or two describing your initial plans on how you will analyse and visualise your data. For non-data stories, you should include the people you’ll be interviewing and other fieldwork that can offer greater insight on the topic you’re covering.
It might be helpful to ask yourself at this stage, How will my data visualisations, and other visual elements simplify complex concepts and data, and amplify meaning?
Having solid ideas about how you’re going to tell this story shows an editor that you’re serious and that you have a feasible action plan. It might also be that final step to convince the editor that this story should be told — and that you’re the right person to tell it.
I turn to Kenneth for a few last thoughts, since, well, he goes through all the pitches that come through and has helped me a lot on honing my story ideas.
What makes one of our editors say yasss to a pitch?
Ultimately, it comes down to answering the question,“Why should I (the reader) care?”
If you got your hands on some cool data or have a burning story to tell about Asia, I hope my guide encourages you to send us a pitch!
