Creating my first data vis story: a process
In which I detail my experience with my first data vis story on spicy food in Asia and hope it helps someone else in a similar place.
In which I detail my experience with my first data vis story on spicy food in Asia and hope it helps someone else in a similar place—eager yet daunted!
Writing anything can be hard. Getting assigned my first story gave me mixed feelings. On the one hand, data vis seemed to emerge from this magic black box of code; on the other hand, I’ve written full essays in a few hours — how hard could this be? The reality ended up being somewhere in the middle. The project was challenging, but not for the reasons I’d initially thought.
Takeaways:
- Just because a story is data-driven doesn’t mean it’s true; focus is on the story.
- Let go of perfection! Do your best, explain your methods, and be transparent.
- Data vis story production involves many people — this brings challenges and opportunities.
Let me elaborate:
Data ≠ Truth
Data vis mesmerises not just for its beauty or technical sophistication, but it seems to present the truth at one glance—useful in an age of overwhelming information. After all, data = numbers, and numbers can’t lie, right? Well, not quite.
The key thing to remember is that you’re ultimately writing a story, and data vis exists to help achieve this goal.
To start, setting the data parameters asks for your personal (read: fallible) input, especially when it comes to the scope of the story and its database.
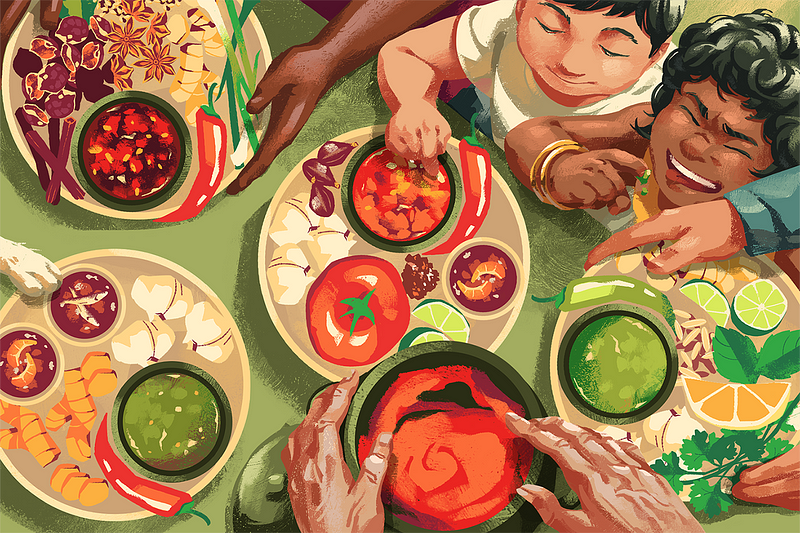
Scope of the story: My original topic had been “spicy food in Asia”. But after digging around and realising the complexity of foods associated with spice or spiciness, I focused on chilli. This editorial decision then guided my search for what data to use.
Scope of the database: To show Asian culinary principles, I decided to create a database of chilli-containing sauces to visualise patterns.


