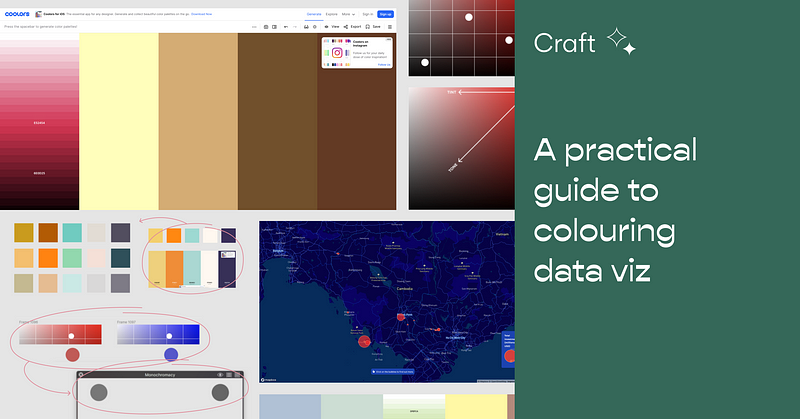
A practical guide to colouring data viz
There are lots of resources out there explaining things like colour theory, but knowing the theory and executing are 2 very different…
Amanda is our UX Architect—you can read more about her and her work in our updated Humans of Konti interview with her!
Colours are a crucial part of data visualization. They provide us with a way to differentiate various elements so we can see the data better, create connections between variables, and set the atmosphere for a story. Yet, choosing colours for your data viz can be so intimidating at times.
There are a lot of articles and resources out there explaining things like colour theory, accessibility, how colour relates to data, and even colour palette generators! These resources are often based on theory — but knowing the theory and executing it are very different things.
Even as a designer, when I first started learning about applying colour and accessibility to data viz, I was so overwhelmed by all the resources out there that I was wishing for someone to share their process with me. So, now that I’ve gained a bit more experience and confidence with data viz, here’s a quick and practical guide showing my process for using colour.
Step 1: Understand the context of the story/data
Before I begin any data viz work, I always make sure that I understand the context of the story or data. This could be in the form of reading the writer’s draft or doing some quick research about the topic. It’s very easy to look at the data and assume a story’s direction, but we may not always be right.