Visualising a team bonding retreat
Inspired by the Dear Data project where two designers sent each other visualisations describing their week, our team decided to try…
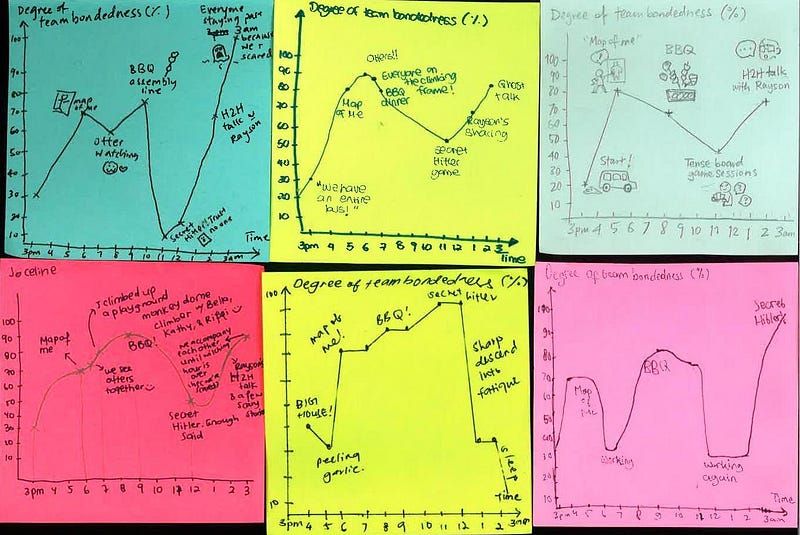
Inspired by the Dear Data project where two designers sent each other visualisations describing their week, our team decided to try visualising how our team bonding went!
As the ultimate goal of team bonding was to get closer to one another, we plotted the time we spent together against the degree of team bondedness 🌝.
First, everyone plotted their experiences independently.
Then we combined them together in a graph to see if we shared similar sentiments.


