How does our built infrastructure affect our lives and our identities? What do these indelible marks on our landscapes mean? These are some of the questions asked at a new exhibition opened by the Singapore Art Museum, titled Lonely Vectors, where a map of ours is on display.
While I’m not an artist, these are questions that I’ve had for a while. For a long time, buzz words like “trade”, “urbanisation”, “infrastructural development”, and “foreign investments” represented a time of hope and change, of progress and advancement. They uplifted communities and, for a country like Singapore, described a “miracle”.
But at some point, these words became red flags. They signalled poverty, inequality, uneven distribution, and displacement instead. In China’s Belt and Road Initiative, the country’s plans and investments were seen as a double-edged sword—involving encroachments on land, debt traps, and unsustainable (maybe even irresponsible) development. The development of hydropower, once seen as a clean, renewable energy source, now leaves destruction in its wake, displacing communities and threatening biodiversity. The internet, meant to be a great equaliser as it democratises knowledge, has also caused vast inequalities within countries and between nations.
Conversations around infrastructural development, trade zones, and money flows can be boring. They are uninteresting to most, but they are important to talk about because of the real impact it has on livelihoods and identities. For some countries, these are decisions that incur heavy trade-offs—at what costs should advancement be pursued?
If your communities are grappling with these questions too, we want to hear about them. We’re always ready to listen at hello@kontinentalist.com, or on any of our social media channels. We’d love to hear from you.
Featured Story
Our latest story, Money flows: Who's investing in Laos, and what problems do they present?, has been a work in progress for a year. Our main goal, as we went into this story, was to understand where the money flowing into Laos came from, and who is involved in this process. We wanted to, essentially, follow the money and see where it leads us.
What we did not expect was how tedious the data consolidation and gathering process would be. We spent months and months consolidating a variety of data sources, and digging for information about specific companies involved in these projects.
To visualise most of this data, we used Flourish’s “survey template”, a personal favourite of mine. This allowed us to show theis data according to various categories, such as grouping the projects and companies based on type and status. We could also size them by how much they cost, and Flourish now has these nifty panels that appear and provide more details when you click on a data point.
For this story, we also really wanted to explore a no-longer new feature of Mapbox–3D terrain. Laos is a very mountainous country, and its geography is a crucial reason for the country’s decision to invest heavily in hydropower infrastructure. We illustrated this by marking the projects on a 3D map, where you can see how many of them end up in river valleys.
Another key visualisation for this story was the network graph of companies. Our data visualisation designer, Bianchi, helped us join our two major datasets—connecting our list of companies to the list of existing projects—and further tracked their parent companies as well. The end result was a really complex web of connections, showing how some companies have a dominating presence in this industry. We colour-coded the company nodes by their countries of origin, and readers can navigate this data by clicking on a country tab, which will give them information about a certain country’s investment behaviour.
Lastly, it was reported by the AidData team at the College of William & Mary that Laos was in quite a pickle with its debt situation in relation to China, more so than any other country. Emulating what the AidData team had already done on their own, we used their data to draw out a scatter plot which compared Laos to other countries, and re-titled the viz to make our message explicit.
It took us quite a while to pull everything together, but we’re really glad it’s done and published. Now, we’re working on cleaning our data a little further so that it can be easily shared with the public!
...more from us
Stretching from Central and Southeast Asia to the rest of the world, what kind of footprint is China leaving with its Belt and Road Initiative?
Hydropower development and climate change threaten the Mekong’s natural flow—and the food security of all who depend on it.
Is foreign direct investment always a force for good? In Cambodia, locals might beg to differ.
The Internet runs on submarine fibre-optic cables and cellular towers—and Asia's getting more of both each year. But what's the dark side to this connectivity?
Medium
“When you first look at data visualisation, of course, you are attracted by the visuals. But if you’re really aiming for impact — to make a change in our society, to change laws and policies — data and visualisations are actually just tools. Ultimately, it’s about the story, and presentation is secondary — what kind of information have you delivered? That’s something I’d like those who do data journalism to always remember, because that is how we build our values.”
The centre of the world still lies in Europe, according to an analysis of global air connections.Explore
What was the world’s longest regular shipping route? Come on board the China Ship! Read
Did you know?
The royal city of Luang Prabang sits at the confluence of two major rivers—the Mekong and the Nam Khan. Envisioned as a naga (a mythical half-human, half-cobra being) with its head at the junction, and its tail to the south of the city, its sacredness lies in the joining of these waterways and the belief in the spirits that hold guard over them. Alliance with local water spirits was considered vital in the past to ward off disaster and challenge rival regimes. Kings would often bring offerings and pray for these spirits to aid them in war.
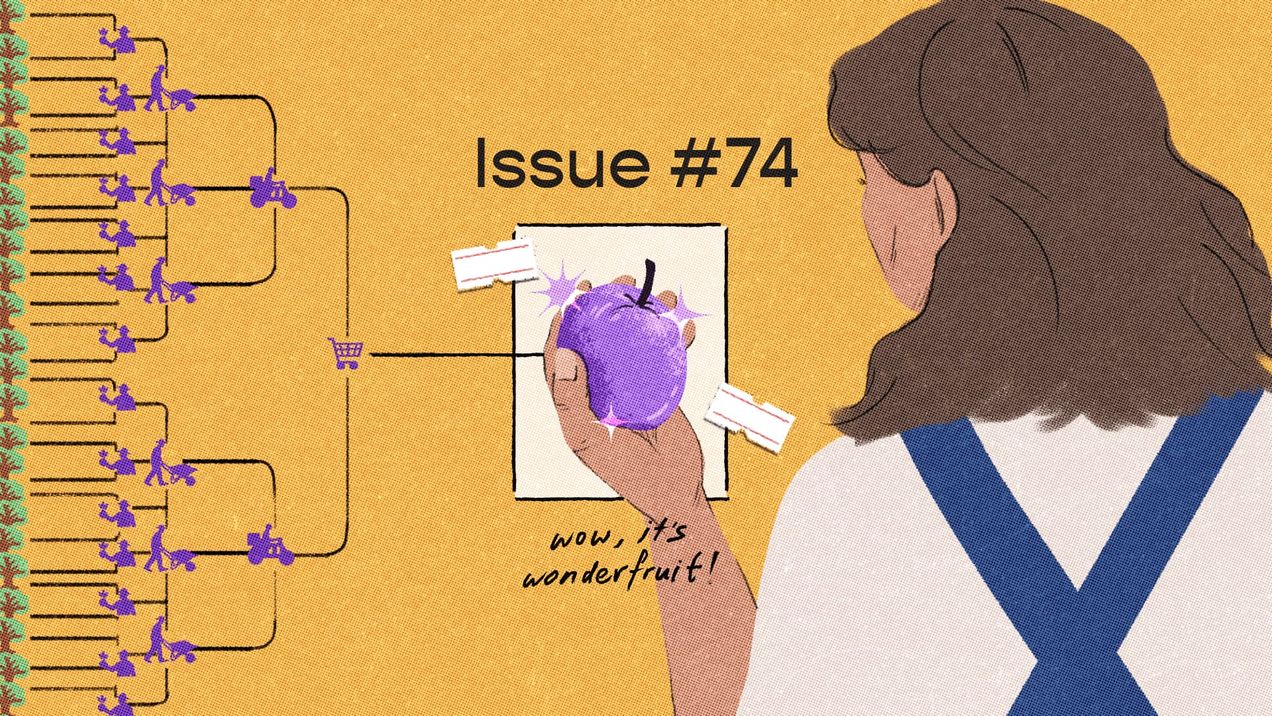
What would you do if you discovered a new resource growing in abundance on your land? What if it comes with a cost? Human behaviour is age-old, and we seem bound to repeat the choices that have echoed throughout history. We ponder access, utility, and the secret calculations we make every day.
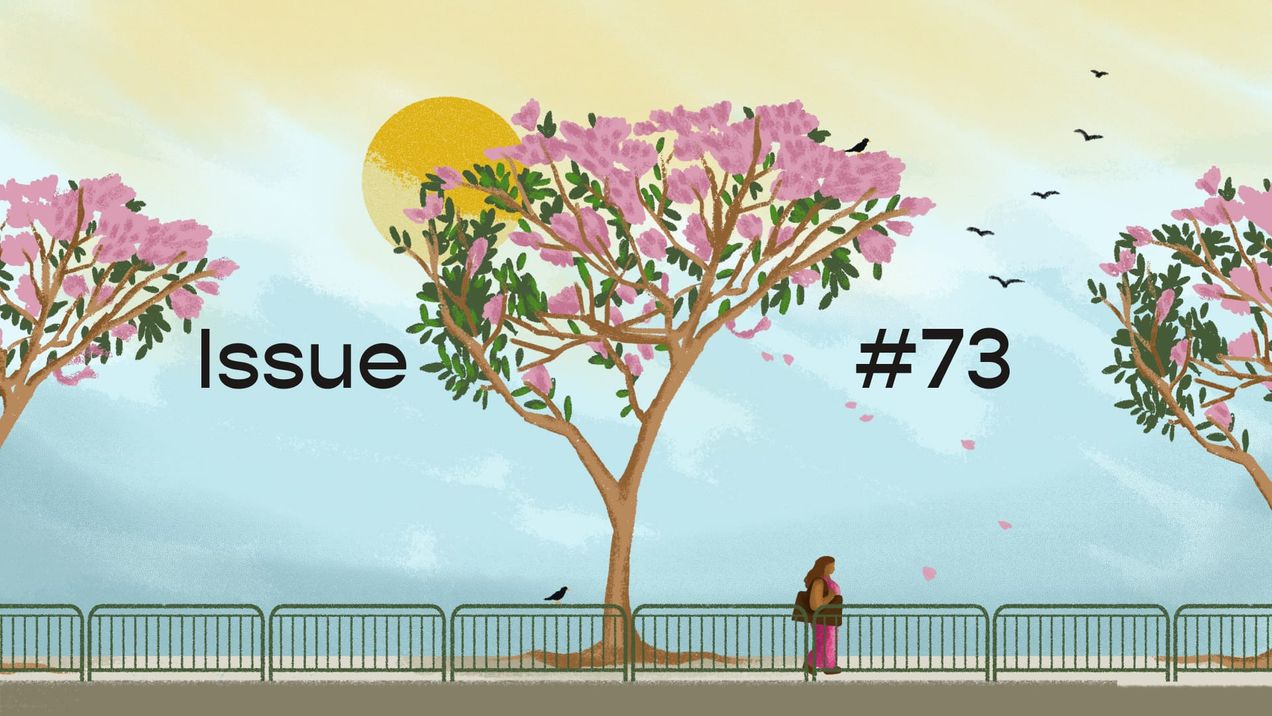
Our climates and futures are linked across borders to one another. From the turbulent climate crisis rocking Southeast Asia to the data centre boom reshaping our world, we are reminded that our connections are not a choice, and that no one is spared from our rapidly changing world.


