
Meet the Community! Lim Chee Aun, front-end engineer and map viz-builder
Lim Chee Aun is a front-end engineer who loves to continuously learn things and build useful applications. He’s particularly famous for…
Lim Chee Aun is a front-end engineer who loves to continuously learn things and build useful applications. He’s particularly famous for building a slew of transport-related map data visualisation applications which help people with problems he’d experienced early in life. He also builds random fun things like a Mandarin Chinese version of Wordle. Check out his portfolio and writings here, and reach out on Twitter or LinkedIn!

How did you get into the world of data visualisation?
I’ve always been building apps and data viz was just one of the things I wanted to try. It didn’t suddenly cross my mind like, “Oh, I want to do dataviz today!” One of the first data viz-related projects I did 10 years ago was an app that helps the user visualise their friends’ networks on Facebook. It no longer exists, but it was called “How you’re connected”. Sadly, I faced limitations in that project, as some people had thousands of friends and browsers then — Chrome and Safari didn’t exist at the time — were 10 times slower. So the app could only display up to 300 friends before it’d crash.
I’ve also always been interested in maps since I was a kid. To me, maps are like a different world. I consider them a form of data viz because there’s so much data being squeezed into such a small medium, organised into layers and multiple zoom levels.
How would you describe your data viz style?
My data viz work so far mostly involves creating utility-based maps. In my mind, there’s the data viz world, the mapping world, and the app world that’s made of people who build apps. I dabble in all three worlds, so it feels like combining them all is a thing only I can do (laughs). I think there are some people — perhaps journalists — who are very focused on data viz and can create a story out of it, but I’m not very good at making it meaningful like they are (laughs). And then there are people who are real experts at maps — their work is often created with detailed cartography knowledge and they spend a lot of time optimising how their maps look, but I’m not at that level of skill yet (laughs). I’m at the middle ground at intersections of these domains but not an expert in any one of them.
Why the focus on building transport data map visualisations then? (Chee Aun’s produced some of the most well-known transport-related web data viz apps, including BusRouterSG, RailRouterSG, and TaxiRouterSG.)
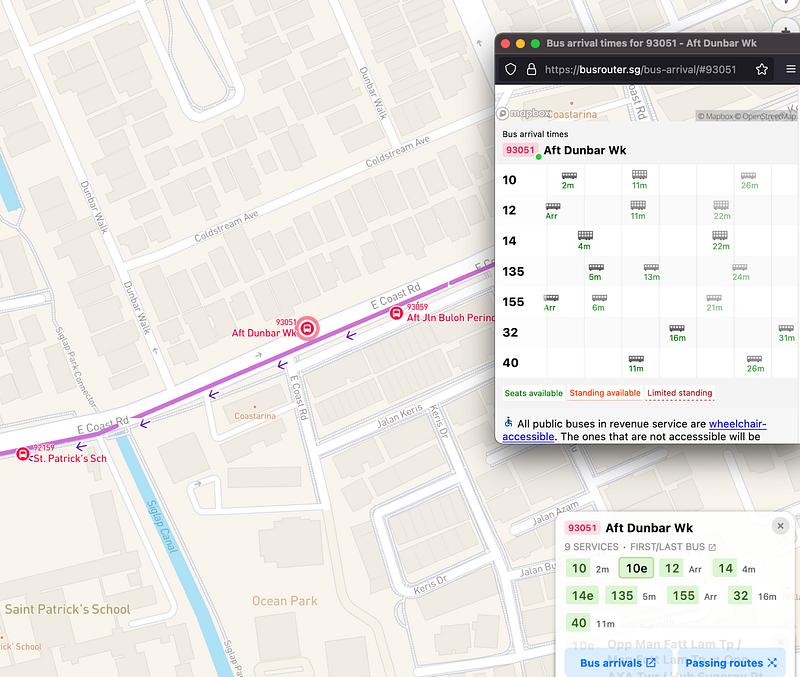
My first public transport app was BusRouter. It goes back to where I’m from, which is this very ulu part of Penang, Malaysia, where I spent a lot of my life before moving to Singapore. In Penang, I’d always take buses because there were no trains and taxis. I often had to wait for the bus for one hour. So, without route maps, I always had these questions back then such as, “What if I missed the bus?” or “Which place does this bus go to?”
When I went to university, I moved to Kuala Lumpur, which technically has better public transport. But it was still not good enough — sometimes the station was too far away from where I lived. I became very aware of these things — for instance, there’s a bus station, but I have to walk under the hot sun for 25 minutes to get to it. And since Malaysia doesn’t have good walking pathways, I’d basically be walking by the side of the road the whole time (laughs).
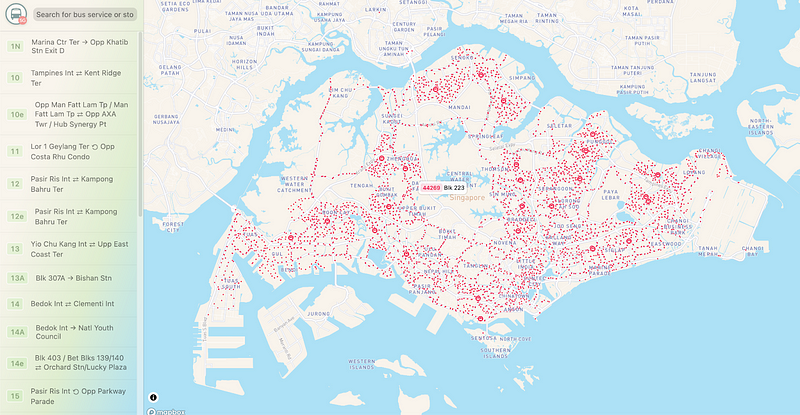
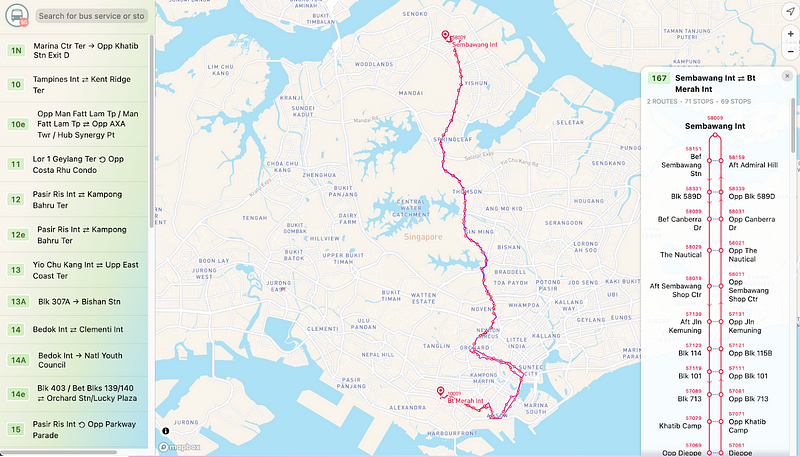
When I moved to Singapore, I thought, “Wow, everything here is so good!” I found some data from the Land Transport Authority’s (LTA) website and what I always thought would be cool to do — to map out the routes of every bus — became possible, even though it’s not in Penang (laughs).
I’m curious, how do you determine what to build that will be useful for others, such that you would spend time and effort building it? Do you do user research or ask your social media followers or friends what they’d be interested in?
In the beginning, I built my works for myself (laughs). Because I would use it and I was curious about it. Then, after releasing my work to the public, some people contacted me directly, and the most frequent feedback I got for the bus viz was, “There are missing bus stops!” (laughs). And I would respond, “I’m not really LTA though, you can report the missing bus stops to LTA if you want to”. I was just joking then, but the guy who gave feedback actually reported it to LTA and LTA fixed it!
Where do you get your best ideas from?
I’ve blogged about my creative process before — the post is called “Building side projects”. I usually don’t get ideas from people or go and actively find ideas. For me, ideas come from being aware of things around you. For example, when I walk along the street, or when I look at a website — I’d wonder, “Why is it a red colour?” Then I’d dive deep into the thing and try to figure out why.
At that point, I don’t start coding or designing yet. I just keep building the idea in my head over time. Once in a while, I’d open my computer and Google to see if there’s any data on it. If there isn’t any data, I’ll leave it, then I’ll try to Google it again two months later — I might find the data then. Sometimes it’s not about the data, it’s limitations in the technical library — which means I I don’t have the technical ability to do it yet. Sometimes I’m too early in the game and the data is not super accurate yet, so I have to wait for a while — and one day, someone might create something or the government might release a new data set. This process requires time, so it’s quite hard to describe the exact process — I guess the most important thing is that you don’t forget your idea!
How has your creative learning process changed over time?
I’ve become more adaptive. When you want to create a data viz, you get very happy when you first find the data — like, “Oh my god, so much data!” (laughs) Then your imagination runs wild — it’s as if you can visualise it in your head already, how the product will turn out, whether certain parts can be 3D, and how the user can zoom around. But often, the data is not that nice and is usually very messy. Sometimes there are technical blocks too. So I have to rethink my ideas all the time, and not get fixated on a certain angle or how I initially wanted my data viz to look.
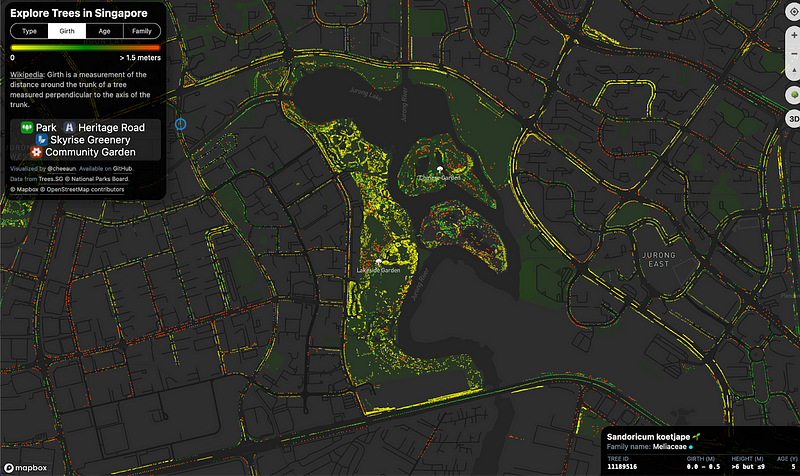
ExploreTrees is a good example. Actually, in my mind, I had imagined it to be much better than what I have now (laughs), especially for the 3D aspect. Initially, I had a lot of ideas — I wanted the trees to be visualised by species type, for example, a palm tree would look like a palm tree. I also wanted to depict the position of the sun and cast a shadow on the trees based on their shape. This way, if you know where the shadow is, you can plan your walking route under the shade (laughs).
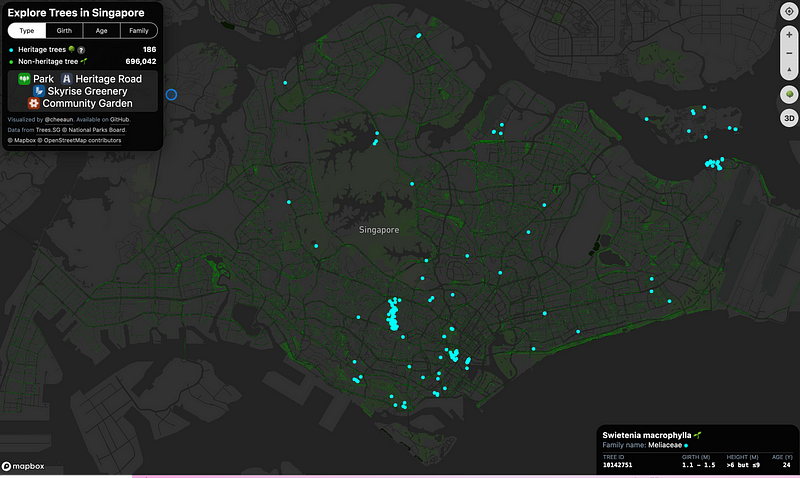
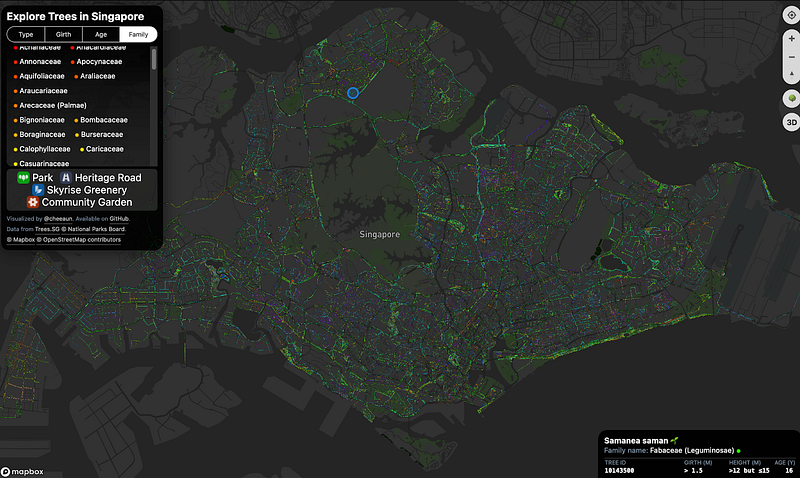
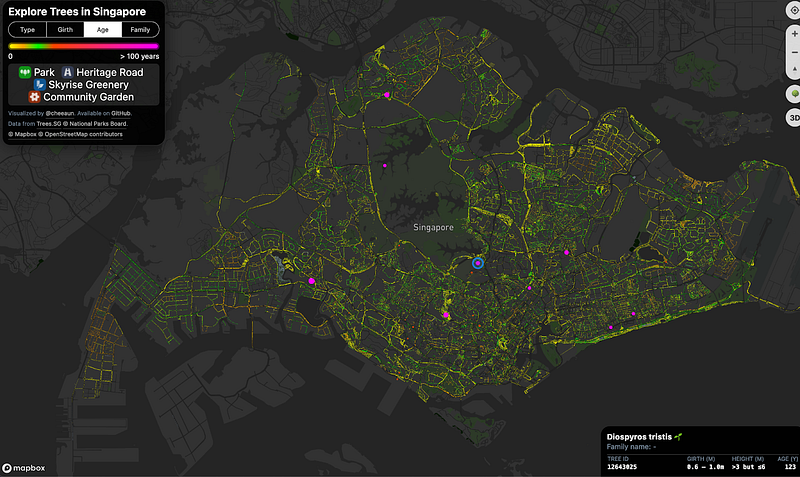
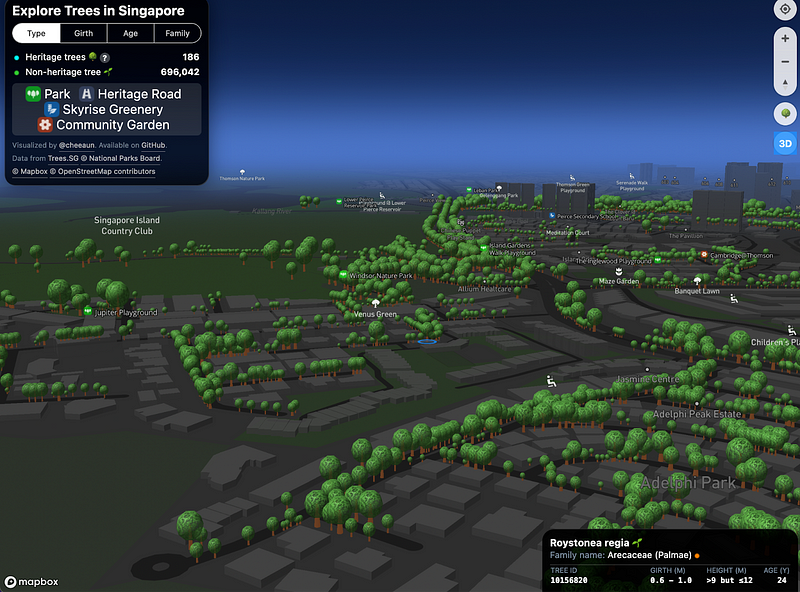
I didn’t know anything about trees before doing this project and when I looked at the data, I realised there are so many tree species, so many families, so many different tree shapes, and there isn’t a pre-existing dataset linking tree species to a 3D model or image file to easily upload. And every single species looks different too. So I couldn’t do it. Maybe in the next two or three years I might be able to, but back then I had to downscale it a bit.
I also wanted the trees to be 3D, but I couldn’t make it realistic enough. There’s a lot of 3D models online, but if I try for realism, it will never look exactly the same as the real-life one, and people might then compare and complain about that. So I thought that maybe I shouldn’t make it real, just partially real, like cartoon-ish.
So I guess this is my strength — I always manage to revisit things. Over the years, if you keep going through this cycle of building and failing, it becomes natural. So when I have to give up, I don’t feel anything anymore (laughs). Because I know that I’ll keep the project in mind and, you know, maybe in the next two years, I’ll revisit it again.
Wow, so being kinder and more patient with yourself expands the time you have for your projects because you trust in yourself to go back and improve it as the technology also improves?
Yeah, it’s more like I’m positive about the future. I would describe it as a product-building or startup mindset. Due to many years of building stuff, I know with experience that even for the current apps that wow me, those apps will continue to improve every day. There will always be new things. If I can’t do it today, it’s alright. In the next one or two years, I should be able to do it, so I don’t feel bad when I drop any projects. I just tell myself not to delete all the stuff (laughs).
How do you see your work evolving going forward?
I’m getting more interested in 3D maps. Last time I tried it, there were very obvious technical limitations as browsers weren’t great yet. For instance, raster maps can be converted to vector maps, and to implement vector maps, you need Web GL, which only a few browsers can support. A few years ago, browsers started to support it — that was when I was like, “Cool, finally I can do it!” These days I’m very interested in deck.gl, a data viz library for maps, initially made by the people who worked at Uber.
Are there any people or projects that you look at for inspiration?
For visualisations, I often refer to Craig Taylor — his work is very relevant to what I do and he often creates way cooler projects than me. Since he uses mainly Blender [but now he’s more into using Houdini, from his tutorials], which is a game rendering engine, he can create way crazier things — so he did a project about bus routes with the bus animated to move on the 3D terrain, so the bus looks like a glowing moving ball on a 3D plane. It’s so, so cool.
Other inspirations are Mike Bostock at Observable HQ — everything he does is awesome. It’s kind of weird that even though I don’t know him personally, his work has affected me so much. Another one is unfolded.ai from the guys who built deck.gl. I also really like the creator of Leaflet.js, Vladimir Agafonkin, who’s working for MapBox now. Diana Ow and Hannah Yan Han are two people in Asia whom I follow too.
I’m curious, is there something you wish you had learned sooner?
Something I wish I’d learned sooner is D3.js. I always come across D3, especially when I do data viz work. It’s a library for data visualisation and it’s quite crazy that it survived for so long. In the beginning, I was quite intimidated by it because there are a lot of new tools, as well as many data viz-specific terms and data viz-specific concepts that I wasn’t familiar with.
So even though you were super fluent with using JavaScript, D3 was still very intimidating for you?
Yeah, because every framework is a set of vocabulary that you have to learn, and D3 is a very huge framework with a lot of things under it. Even colour — you’d think it’s simple, right? But turns out it’s very complicated — they give you palettes for different types of data, and even delve into colour theories. So at the beginning, I avoided D3 because I was thinking of finding something simpler. But every time I do my data viz stuff, I realised I always went back to D3 no matter what.
Are there untapped topics or technology in this part of the world that you see a lot of potential in?
There are a few. One thing I’m always looking forward to is having more open data, especially from the government, from every single country. It would be better for the data to be as detailed and as accurate as possible — because sometimes they release data, but it turns out to be outdated and I think, “What’s the point?” (laughs). You can find good examples from other cities, such as New York’s open data portal, in which they actually have data for every single building in New York, which is so cool.
But maybe the issue is that it’s tough to create products that are localised to different Asian countries. In this region, different countries have different languages and internet infrastructure. For example, I used to work for a travel startup (laughs) and the products I created had to work in all countries. Thus not only do you have to make your website work in different languages, you also have to know that, if the website is in Japanese, then the words will be shorter and you can fit in more content. This will obviously affect your maps, your data viz, everything.
Okay, to summarise, a missed opportunity with regards to data work in Asia is the lack of public official data that’s clean and detailed, right? And it’s in part because of our incredible diversity in languages used and our varied internet infrastructure.
A piece of advice?
[This was taken from one of Chee Aun’s writings] If I tell you, ‘you should start here’, that’s too straightforward. You’ll bypass the joy of figuring things out yourself. Curiosity works like magic. It will take you there.
Editor’s note: Luckily, Chee Aun thoroughly documents his work process for every project. Each article is rich with learning points and reflections, so do give them a read. Here’s a selection:
- Chengyu Wordle: Chee Aun recently built a Mandarin Chinese version of the hit game Wordle, and I’ve heard it’s very fun (and challenging).
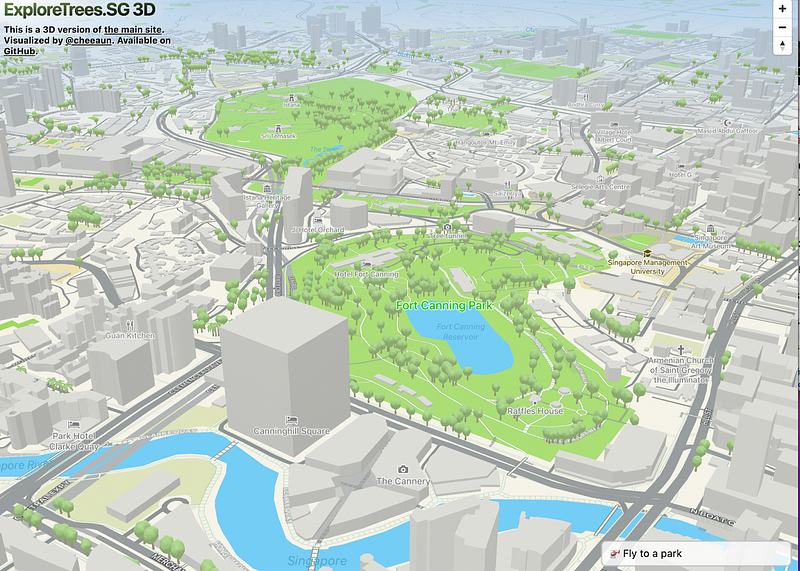
- Building ExploreTrees, how he improved on it by rebuilding it with Deck.gl, and how he improved it with Apple Map’s new 3D function
- Rebuilding TaxiRouter
- Building BusRouter