
Meet the Community! Jane Zhang, data viz designer and e-commerce strategist
Jane Zhang is an independent data visualization designer based in Toronto. She’s made a name for herself with her recognisable static…
Jane Zhang is an independent data visualization designer based in Toronto. She’s made a name for herself with her recognisable static visualizations that change the way you see and understand everyday subject matter, from board games to food menus, personal health and heritage. Together with her design strategy background and digital marketing experience, her writings and process walkthroughs are consistently frank and insightful — you can check them out in her blog and newsletter. She even has a YouTube channel you can watch!
How did you get into data visualization, and what about it appealed to you?
When I was in design school studying design strategy, one of my instructors showed me Information is Beautiful — that was the first time I learned this was a profession. [I also learned about Nicholas Felton, who recorded his personal data, and Edward Tufte.] Also, [dataviz] felt like a good [fit] between my science background and design strategy background.
How would you describe your dataviz style? It seems like you’ve settled on static viz and non-linear styles; less coding, more illustrator heavy and some data physicalization.
The things that I focus on making are similar to a book. Whereas a book flows page by page, what I do allows you to take the pages apart, so you can rearrange things to form new narratives, new understandings, or new groupings. That’s a high-level understanding of my work. [Although] a lot of data visualization right now focuses on telling you what is happening, it doesn’t really challenge you to understand how to think about it — I aim to help you understand how to think about something that’s really important.
Also, I do things very purposefully. I only go to places where it doesn’t make sense for a dashboard to exist. Dashboards are really good for big data; the things I tackle are much smaller datasets, which don’t make sense to automate. So my static viz style exists in that format because there’s a market gap — places where big dashboards, coding, and interactive visualizations don’t bother with.
How did you come to realise this dataviz style of yours?
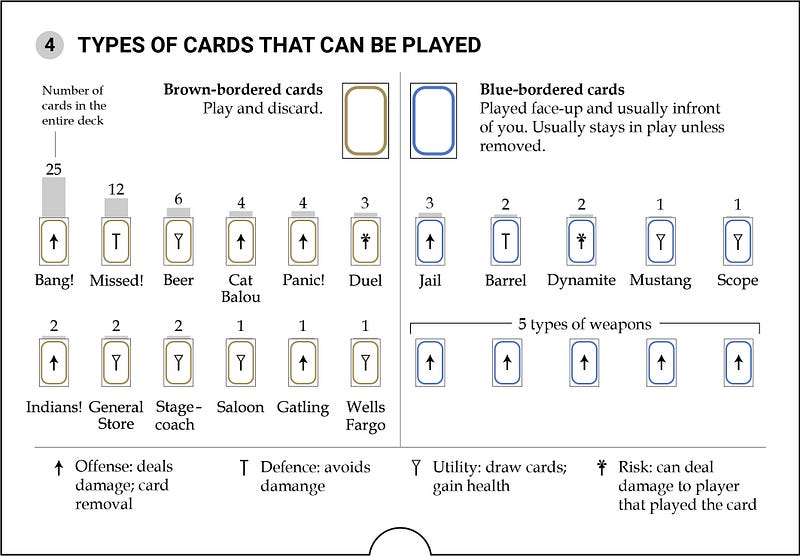
There was a lot of experimentation [through personal projects]. [It started with] “Bang!” [where I used dataviz to] teach people how to think about how to play the game. The game’s ruleset tells you what to do, but it doesn’t tell you how to think about strategy. If you do a simple histogram of the game’s cards, you quickly see that it’s an offensive game that’s meant to be played really quickly. And, [though I played this game like a 100 times] I never realised that until I made a histogram. It showed the defensive cards don’t come up as often, giving them more value. If I knew that, I would have tried to keep those cards more, and played more strategically.
The Tekken project evolved that idea by engaging actual users. Instead of saying, “Hey, I made this thing, and here’s the end result. Hope you like it”. It was now, “what is a problem I can help you solve with this?” So I involve them that way. That’s where that style started from.
Could you elaborate more about this process [of engaging the user]?
When I made [Bang!] I didn’t consult anyone, I just did it for myself and then shared it on Twitter. But no one really cared because people who follow me are data viz people. And I thought to myself, well, they’re probably not the right people who care. This is when I started using Reddit — I found the board game community, and I shared it there, and it got a lot of traction. People said, this is actually a big challenge with board games: they’re not visual enough. People gave me a lot of feedback that was not given by the data viz community, as I got people who actually care about the topic, not the tools.
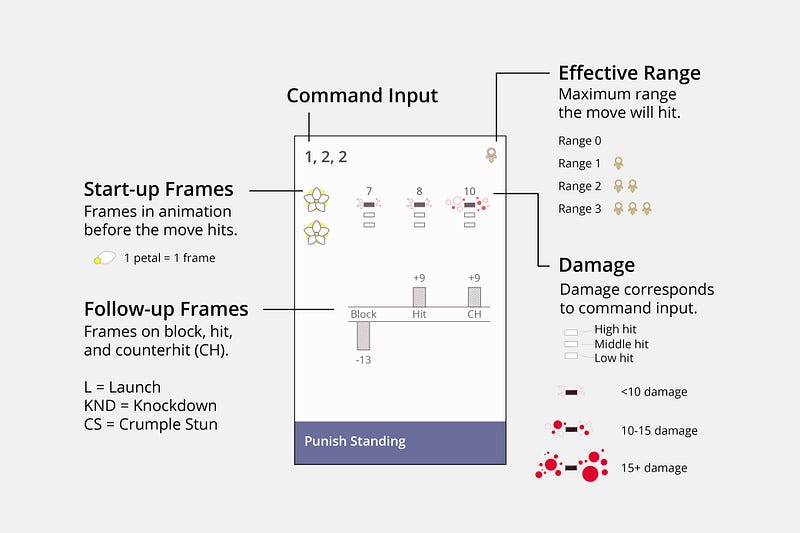
This is a problem a lot of designers or entrepreneurs have — they have an idea, but they don’t check if it’s already been solved. So, [for Tekken], I checked with the Tekken community, [if there existed] some visual format of the data [they used] to learn the fighting moves. They said, “not really, but I think people will be interested”. I made a first version prototype, which I put on the Tekken subreddit, and they were like, “what is this? We don’t want to see this, it’s so much easier to reference a data table, you’re making it so complicated. Why do I have to learn this complicated legend to learn to read it?” And I was like, I want to cry. (Laughs)
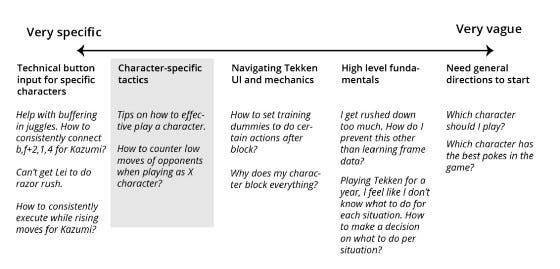
But afterwards, when I was thinking about it I was like, they have a point. I shouldn’t feel like they’re attacking my pride or ego, they’re giving me objective feedback, which is, “this doesn’t help me”. One of the moderators said very nicely: “consider asking a proper question about the problem because what you’re addressing right now is not really solving anything”. And so I said, “Okay, I can either give up or I could try it one more time”. So, in this subreddit, they have like a beginners mega thread [which lists all the questions and problems people had]. This was how I started to identify problems the community was experiencing. That’s how I started engaging people; I really try to listen [and find problems because it’s actually really hard to do that].
What do your data viz projects tend to be about, and what are your motivations? Aside from Bang! and Tekken, which are two big game projects, another cluster of projects you’ve done are projects about personal data collection.
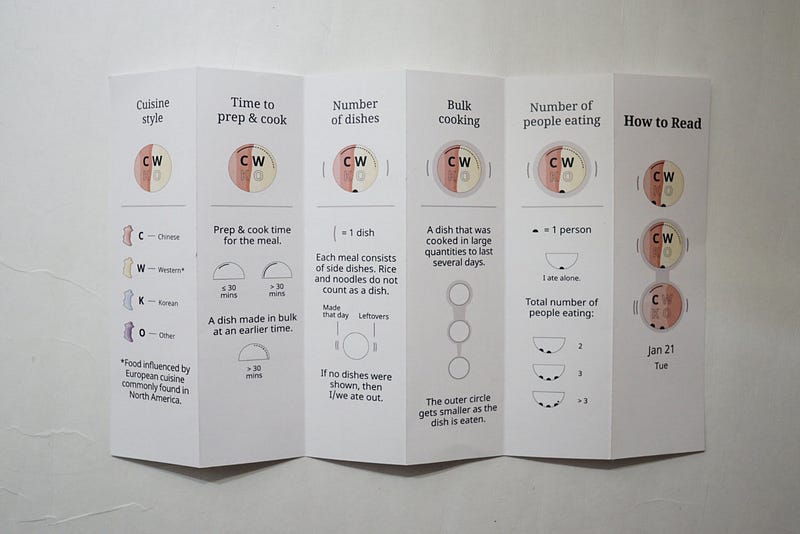
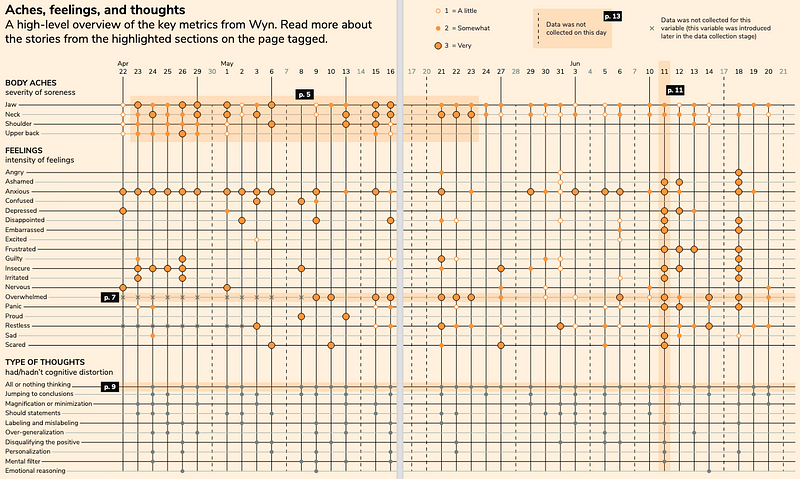
All the stuff I talked about is part of a category I define as “visualizing the world” — it’s about bringing data viz to places that normally don’t use them. That’s the second category, and that’s the one I’m focusing on. [The projects about personal data are] something I call Data Documentaries. One of [them] was about anxiety using embroidery. [The other big one] was the Wyn project, documenting mental health and physical health. And that one was really meaningful to me, because I went deep diving, collecting data for a long period of time.
What’s interesting about [these personal projects] was I was able to refine my style. When I think about data documentary, I think about it competing with a film documentary, not a dashboard. With a film documentary you understand it, frame-by-frame, second-by-second. Within a visualization, you can sort of condense all that within a sheet of paper. It was really personal. And a lot of people responded positively to it. Someone said to me, “I’ve never been able to talk about something like this, but you’ve really inspired me to think more about my feelings, to reflect more”.
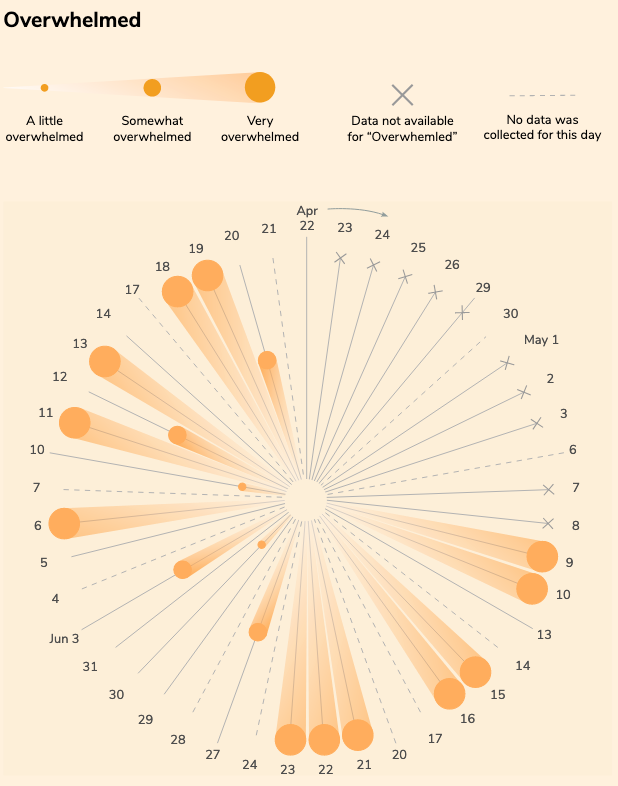
I think [I’m motivated by] a mix of curiosity to understand myself better and to help others. For my project about my personal health, [I did it] because I had a really hard time managing it. I kept thinking, “Oh, I’m just like, anxious about these things”. But [when] I was recording the data every single day, [what] kept coming up was “feeling overwhelmed”. And then, because I was able to identify that, I could do something about it. [I could ask], “why am I feeling overwhelmed? Why am I trying to commit to too many things?” And then it becomes actionable. I think when you record your own feelings, you’re better able to do something about them, or you’re able to talk about it. So, it actually solves a huge problem for me.
[How have your wider career experiences shaped how you understand dataviz?]
Design strategy was the foundation of how I was able to think [in a way that understands things in context]. When I was in [Institute Without Boundaries], whenever we came up with an idea [for our real-life assignments], all of our teachers were like, “why would someone buy this? Just because you came up with an idea doesn’t mean people will just come and buy it, you have to think about what would incentivize them”. So that’s the kind of thinking I had.
When I finished school, I started working in operations at a startup, [where I could practice] everything I learned from design strategy. And [I freelanced in social media marketing], which is very much like a twin of user research/user experience design. Because you have to think about the end user or the customer, you’re thinking about, “what do they want? Why did they come to you? ” And I listened to a lot of marketing podcasts.
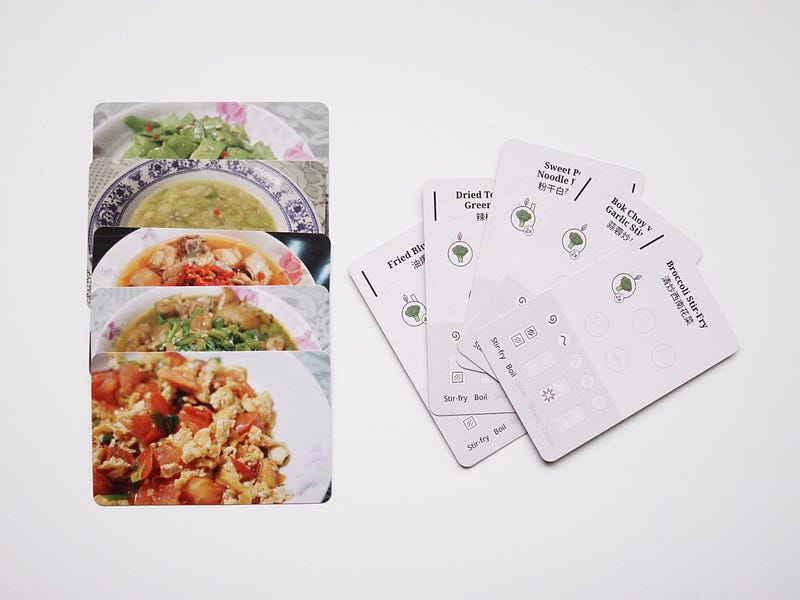
What ended up happening is I’m able to think ‘bigger picture’ — I’m always thinking about what is the purpose of data visualization in the context of the world? Because I think about my mom, like, how is she using it? How can mediums beyond traditional mediums benefit from dataviz? Look at cookbooks, cookbooks have so much data. But what if you got a data viz person to design it? So that’s kind of how I’m thinking about it. And it’s really a big vision that makes me want to stay in this field, [as] I feel like I’m able to fill a gap that no one else has filled.
How do you know when to give something up and when to keep pushing? I’m referring to multiple instances when you were first trying data viz freelancing, learning how to give up on interactives and dashboards, or coding, in order to prioritise and focus on your strengths.
Initially, it was challenging. The hardest thing with starting is you don’t have a direction. You don’t have a vision, you don’t have anything that tells you to go this way. You don’t have a compass. This is why I wrote one of the articles I wrote for Nightingale — I interviewed 4 people, and I asked them for advice.
How do I know to give up coding? Well, I tried to learn d3.js. There are some learning pains that are enjoyable, and there are some that are actually really painful. Learning how to code was very painful, because I didn’t want to figure this line of code when I could just [use] Illustrator and just put it up right there. I was very adamant to give it time. I gave it six months, good enough time to say, I tried it and I really didn’t enjoy it. Because it’s kind of like exercising or learning something new — it’s gonna be hard at the beginning. But once you kind of get over that, if it still is really challenging and you don’t feel the benefits or joy from it, it’s not worth it. At that point, you’re just forcing yourself to do something you’re not good at.
Everyone has their own aptitudes. You have to understand your strengths and what you’re good at. That’s how I knew I needed to give up dashboards, PowerPoints — I didn’t want to go that route because that’s not why I joined dataviz the first place. I’d asked RJ, “how do you know that you’re good enough to do something?” And he said, “you kind of have to just have faith”. There’s really no other way. It’s kind of like a relationship: how do you know the person you’re with is the right one? There’s no way to know, you have to believe them. And so I just gave it time. And did a lot of experimentation, one project per week, just to see what I could do, what I could learn, my strengths, and what I enjoyed. [Through that] I was able to find there’s still something here [in dataviz that] I enjoy and want to do — [engaging people, working with human stories and working with people’s ideas.]
Do you have one piece of advice for people?
I caution people about freelancing, make sure you have some sort of backup plan. I did social media, and that kind of kept me going for a little bit, [and am kinda going back into digital marketing]. I think people should understand that [it’s really hard to make a freelance income] and also not be discouraged. Just be strategic [and thoughtful] about how you approach your career. For me, I was able to do what I do, because I had some savings and I live with my mom, which allowed me to save a lot of money. But really understand context and understand how it applies to you; doing what feels right and what feels comfortable. Don’t do something because someone else did it.