

Meet the Community! Ben Xiao, Data Scientist and Analyst
Ben Xiao is an aspiring data scientist and analyst, specialised in providing data-driven insights, having graduated with a Master’s degree…
Ben Xiao is an aspiring data scientist and analyst, specialised in providing data-driven insights, having graduated with a Master’s degree in Data Science from Northwestern University. He was once a professional poker player and now spends his free time watching NBA games, poring over basketball stats, driving virtual race cars, and creating bespoke data visualisations. Reach out to him on LinkedIn and Twitter, and check out his latest piece analysing NBA defense metrics and strategy in his newsletter here.
Could you describe your path up until now?
I don’t think I knew what I was gonna do when I was an undergraduate student. Science was what everybody pointed me towards in college — it was like, “this is what you’re kind of good at, so go study it.” Then I took some time to see what a career in science looks like and realised it was very unappealing to me — either you go into medicine, work in the labs or go for your PhD, but that’s a lot of time gone.
So I spent a lot of time playing poker professionally. I’d done it in college for a while, paying for my college education with the money I won, and I realised poker could pay more than what I would earn in science jobs with just a Bachelor’s degree. It’s a pretty easy job too, as you could do your own thing for 9 to 10 hours of the day and you don’t have to wake up at 8am every day.
So it was a pretty natural transition for me to go from using data to make decisions such as how I can assess risk in certain situations, to data science, which I think is more about learning the technical skills to formulate questions like, “What are your models?,” “What are the risks in these situations?” or “How do you predict certain things?” All of that put together is kind of how I got to where I am now — doing a Master’s degree in data science at Northwestern University. [Ben has since graduated!]
Why a Master’s degree in data science, not statistics or maybe even financial risk analysis?
Data science seemed like a better fit for me, because they teach you skills from the ground up. It does teach you a bit of statistics — at least my programme did — but it’s hard to feel like you’ve mastered statistics in, say, half a year’s worth of classes. I hear statistics programmes have problems such as not teaching the programming or engineering side as much, and that’s why I leaned towards data science. I didn’t do financial risk analysis because I wanted to have a more generic degree which lets you explore data science the way you want, because there’s data on everything in the world. So I felt happier doing it this way.
I see. Now, I know you do quite a lot of data analysis on sports. How did you get started with appreciating sports from a statistical perspective?
The following are screenshots of one of Ben’s projects, which marries a life-long love of sports with data science skills! Read the full analysis here: https://towardsdatascience.com/the-evolution-of-the-nba-3-point-line-da6700714ad2
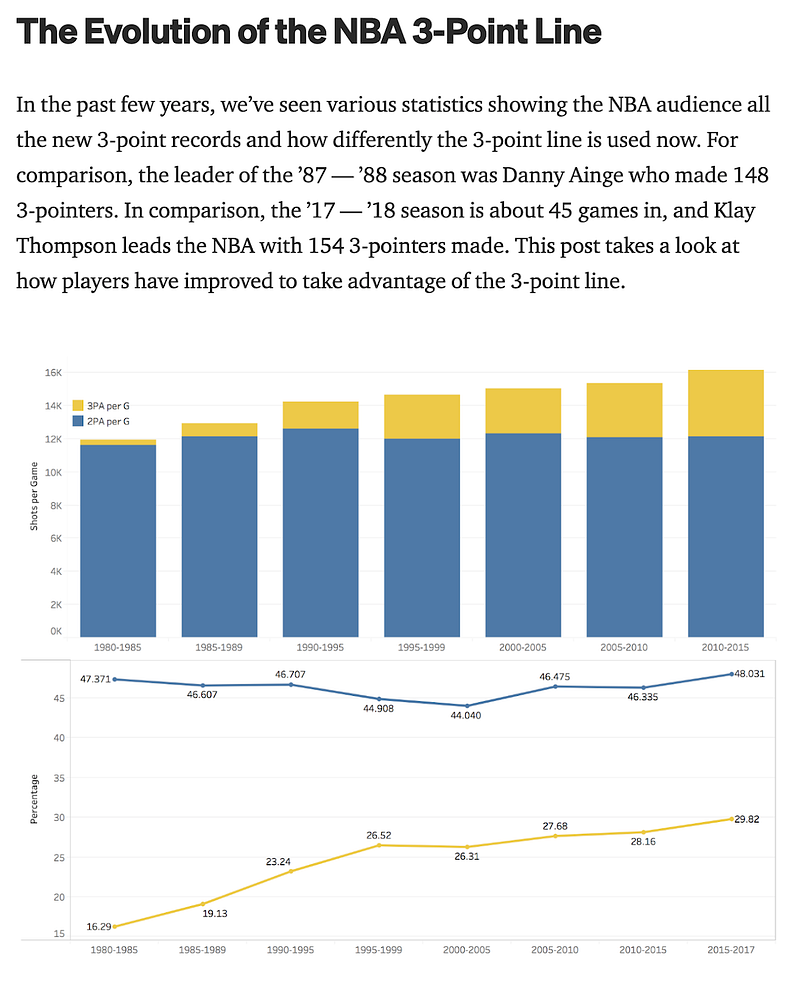
The bottom graph shows how the introduction of the 3-point line in the 1980 to 1981 season caused 3-point attempts and 3-point percentages to rise steadily, while 2-point shots per game remained relatively the same.
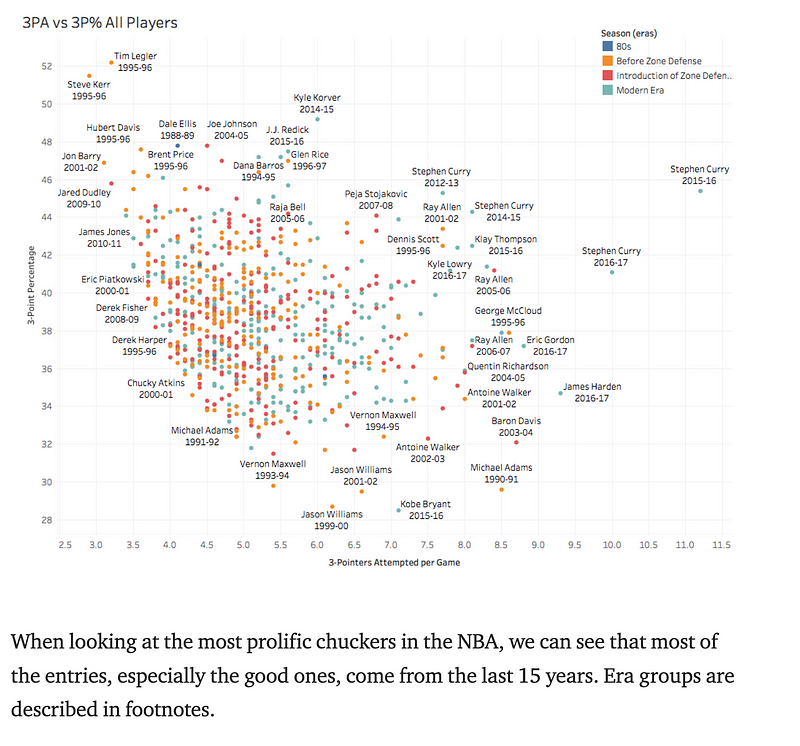
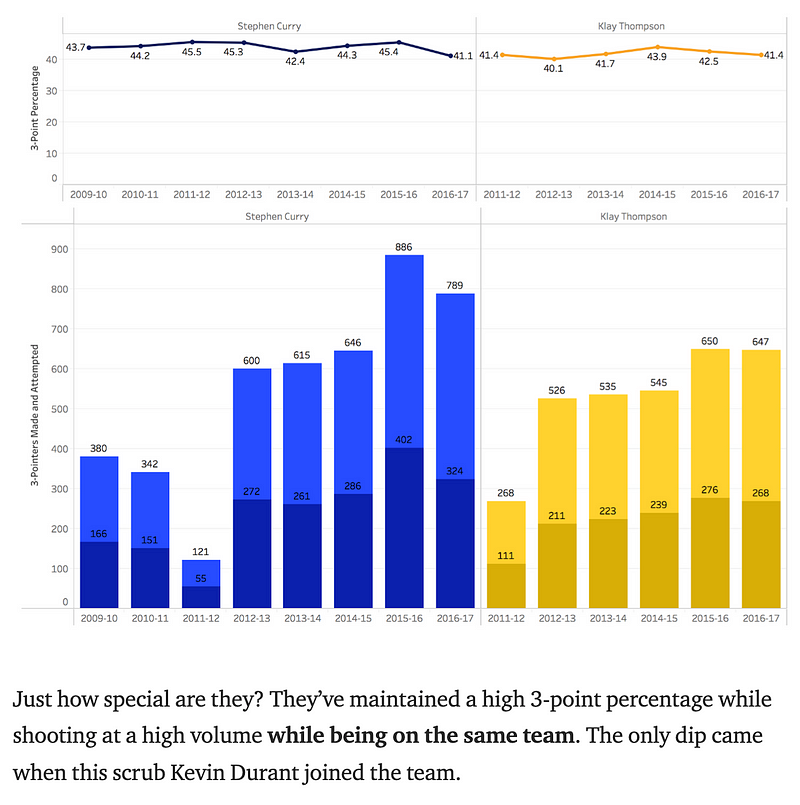
From Ben’s analysis, he was able to see how changing game rules affected scoring spreads. He was also able to identify particular high-performers.
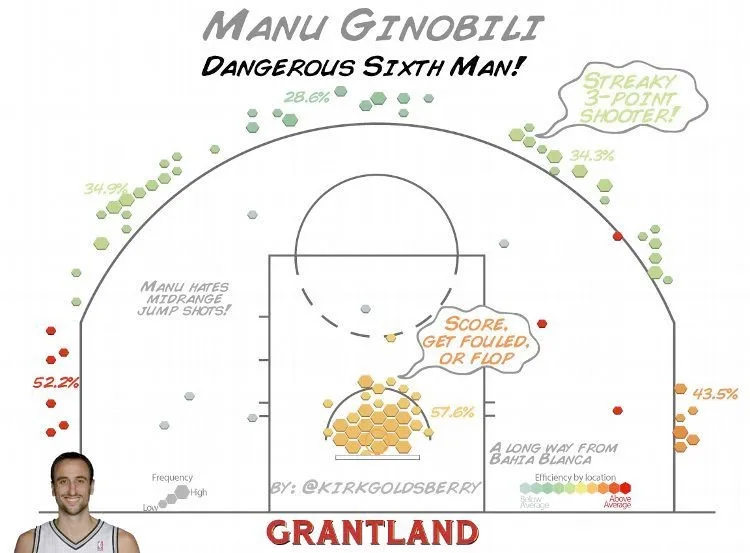
That’s actually where I found data visualisation to begin with. One of the sports writers I follow, Kirk Goldsberry, started mapping out where shots were happening on the basketball court. Once I saw that, I thought it was a really powerful way to show what was happening. He could explain a 5,000-word article in three pictures. Seeing how clear it was, especially for me as a visual learner, that’s when I went, “I get it now!” So it made a lot of sense for me to use this as practice.
So you understand more about games and how they function. You start seeing how the theories behind any sport works. If you’re playing basketball, and you only shoot from two places on the court, then whoever’s playing against you knows that you only shoot from those two places. So they can devise a very limited strategy that they need to play against you. A thing I learnt from playing poker is that taking the initiative to expand your own skill set forces other people to play you differently. The way Kirk mapped it out just combined all of that for me. Once I started thinking about it more, I saw ways to contribute how I think and how I would process available data into something that I can then show other people.
What go-to resources are there for this niche intersection of sports and data visualisation?
FiveThirtyEight has really good stuff. I think because they have a really good data visualisation team on board. There’s an author named Ben Taylor, a cognitive scientist, who has a book called Thinking Basketball that explains the theory of the game. People can read his book to start getting an idea of what data to look for or what data might be true. My Master’s programme has a specific class on sports performance analytics. For the class, we were given a lot of maths-based books for sports, mainly on the three major American sports — baseball, American football, and basketball.
Do you follow other kinds of sports, like e-sports, and are there good data visualisation projects on those?
I only follow Starcraft, and I don’t know of any FiveThirtyEight equivalent for e-sports. I’m not entirely sure why there aren’t data viz projects on e-sports. For traditional sports, you always have people counting something that’s happening. Maybe it’s because in e-sports there’s so many games going on. The gaming companies might have rich datasets, for instance about the number of strikes, matchups, or the timings of attack and defence, that they haven’t shown to the public. I’d want to get a more concrete data viz idea out before reaching out to them to get this data and make a project out of it.
[Some examples of e-sports and video game data analyses co-authored by Ben can be found here and here! After the interview, Ben finished and sent a new game analytics piece dissecting NBA defense metrics, strategies, players, and more. Do give it a read: https://midrangevizzies.substack.com/p/nba-defensive-shot-profiles?s=w]
What jobs are you hoping to go into — are you perhaps applying to a data strategy-informed coaching position?
Yeah, I would really love to do stuff like that. There are a lot of issues with the communication part of things, such as, Will people trust what you’re going to say? Because as a coach, if you create a strategy that is very optimised, it goes against the status quo in terms of how people do things. Telling the people in an organisation who need to execute your suggestions — I can sense there’s going to be a lot of hesitancy.
Going into data journalism for sports, you’re going to show people a lot of things that don’t exactly make sense, so it’s going to take some educating. What are good ways to garner some more trust from the players, coaches, internal managers, or anybody involved? I haven’t figured out ways to manage that part of the job yet.
You wrote on your LinkedIn page that you have a passion for telling stories through data visualisations. What kind of stories do you hope to tell?
Before, it was just for things related to sports. Now, it’s more about looking at anything that I might find interesting. So, after watching your Outlier talk, I’m now interested in how Asians are represented.
I don’t see many Asians or even Asian Americans in the field. There might be a few big names, but I don’t see or hear of many others, whether at data visualisation conferences or when people share information with me. So I’m trying to do more meaningful things for myself, to get out there and show other people that we don’t have to be engineers or work in prestigious jobs to do things that are meaningful.
Story-wise, I think I’m more drawn to things which have an Asian focus now, especially representation in video games. For us, at least in the States, a lot of Asians play video games, and seeing video games become mainstream is very new to us because we’re not used to seeing Asian males in particular in prominent roles. From a storytelling standpoint, it would be centered around how to improve the video games I like to play now. Once I figure out a way to get the data, I think I can figure out the data analysis that will point me towards how to improve the game.
Do you have any person’s or organisation’s work that you would like to try and emulate? Basically examples of work that really inspire you?
The first thing that usually comes to mind is Nathan Yau’s website, FlowingData. He asks some very simple questions, yet he always visualises public data in his own way and creates something really mind blowing. He does this very effectively. Whenever I see his work, I’m always reminded that the project doesn’t need to be really complex; I just need to do it — actually showing up, doing it and then publishing my work. He is very inspirational in that way.
For more eye-catching stuff, I really like Shirley Wu and Nadieh Bremer. All of their work is really nice, because it shows you how creative you can be with your visualisations. [On that note, check out a great piece Ben wrote on navigating creativity and expectations in data visualisation here.]
What kind of tools and resources do you tend to use the most for your work?
I use Python probably 90 percent of the time, because that’s the thing I’m most familiar with. I am trying to learn more about the lower level visualisation libraries such as JavaScript, because I think it’s nice to be able to control elements differently. Otherwise, I do all my analyses in Python, because that’s the easiest one for me to use.