
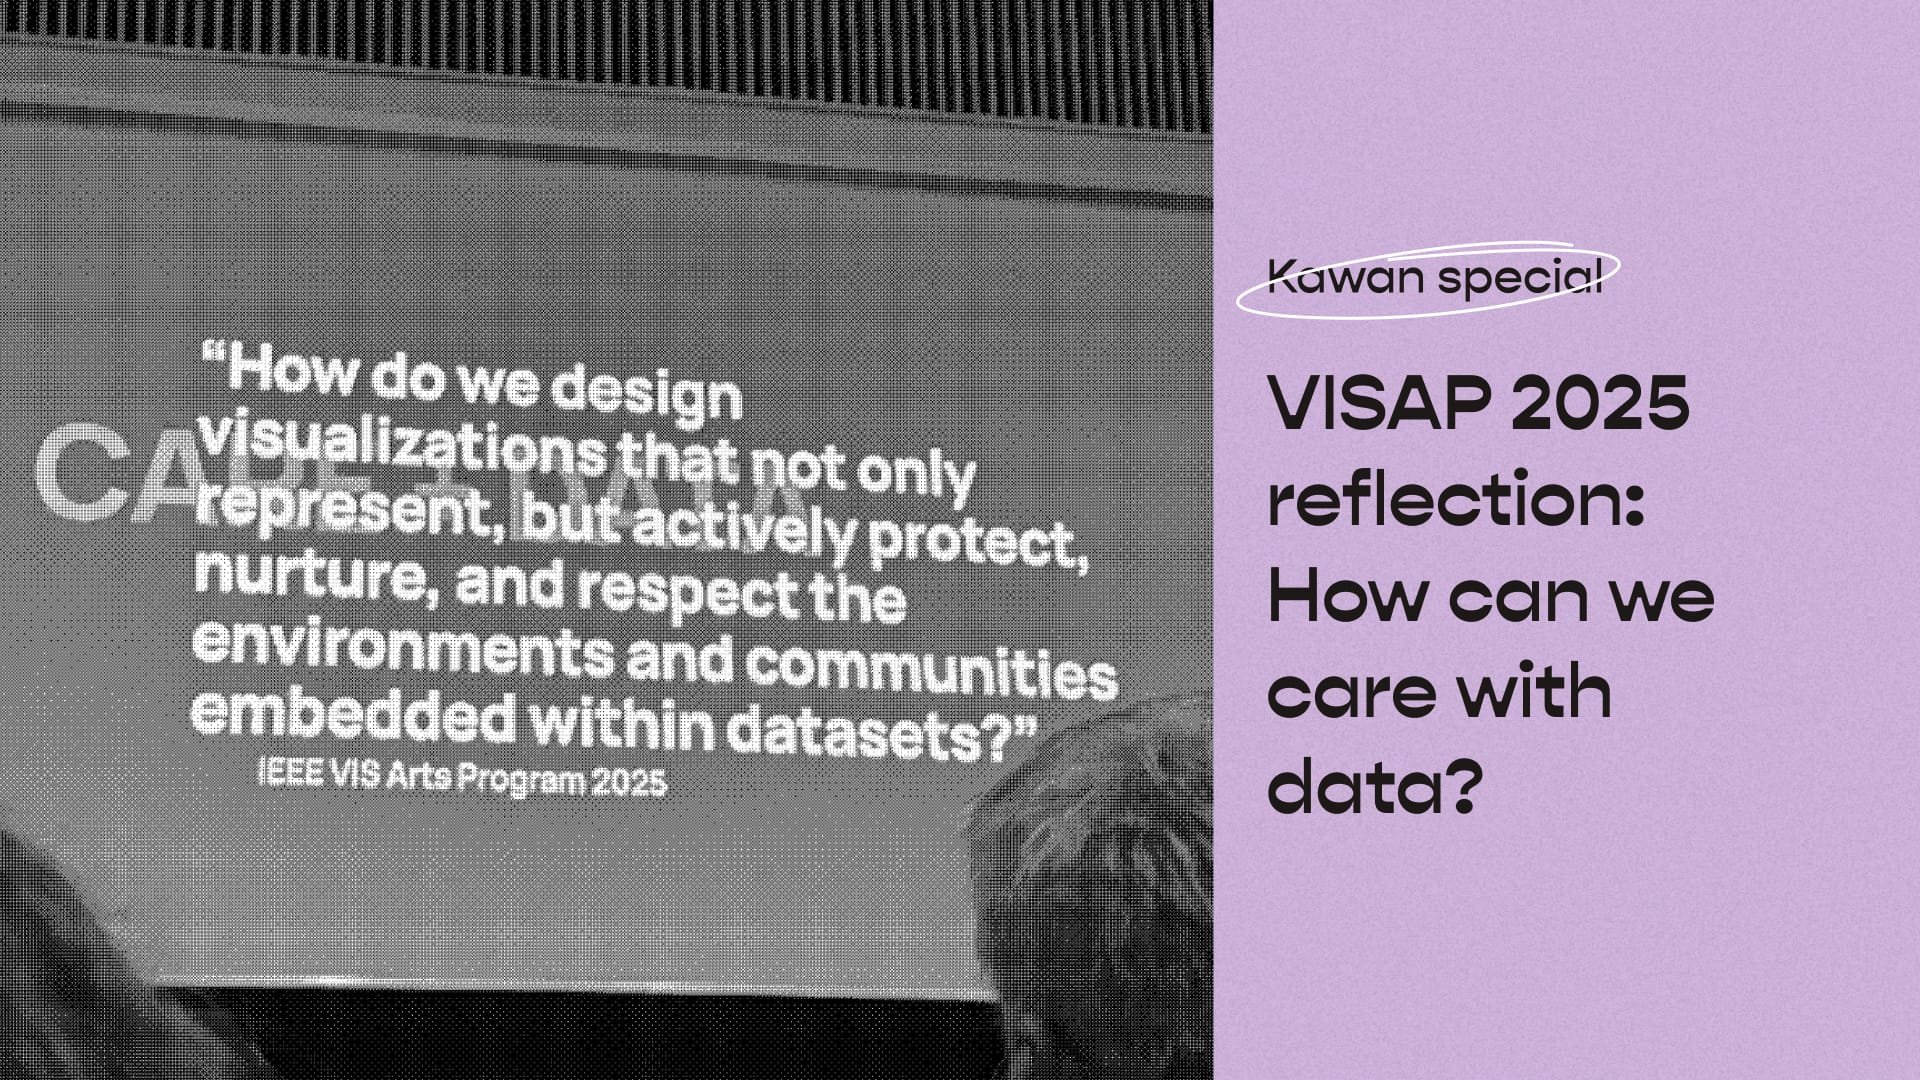
How can we care with data?
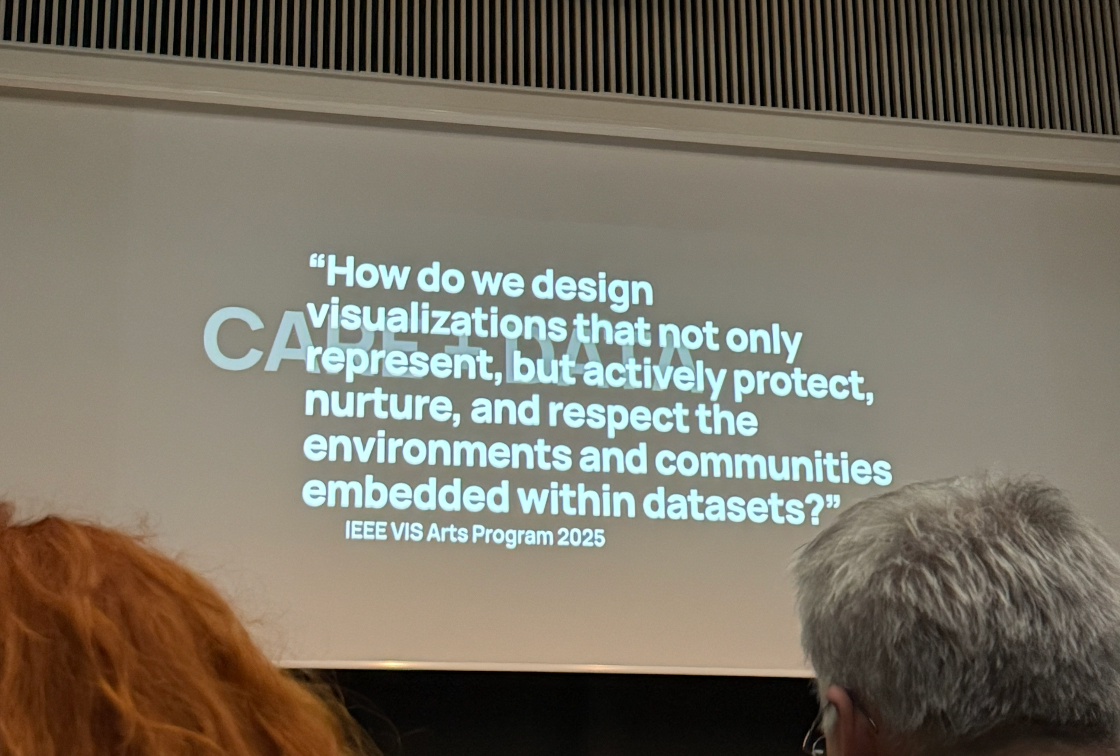
Munirah reflects on Kontinentalist’s experience during the Vis Arts Program 2025 (VISAP) conference in Vienna, where designers, researchers and artists come together to present their approach of visualising data with care, and the inescapable cloud of data as power currencies in today’s world.
The VISAP call for submissions came at a serendipitous time. Kontinentalist has for the last two years been in exploration and experimentation of agnostic forms of data storytelling, and VISAP 2025’s theme of Collective Care was perfect for us. We had just completed several projects that have iteratively shaped our methodology on how we approach data: from our exploration of urban greeneries and desire paths with Singapore’s The Everyday Museum, to our participatory exhibition for Hari Orang Pulau (Islander’s Day) and our digital story collaboration with Visualising Palestine in mapping the intangible memories of lost places. These have nudged us toward approaching data with humanism: grounded in responsibility, governance, and representation.
Our co-founder, Peiying and I represented as speakers (you can view our presentation here) on behalf of the team in Vienna, Austria last year in early November. It was eye-opening to be exposed to a range of data-visualisation works in diverse forms of data visualisation: from digital archives to data physicalization produced by academic researchers, artists, to even nature conservationists.
The Vis Arts Program (VISAP) is a conference alongside IEEE VIS 2025, one of the world’s foremost conferences about visualizations, which invites researchers, designers and artists to share their works and approach of visualizing data with care. Given Kontinentalist’s desire to define our methodology, we decided to submit our annotated portfolio as a paper presenting and reflecting on our body of work with an angle of rejecting colonial practices. To our great joy, our paper was accepted – our very first academic publication!!
Inspiring data-driven projects at IEEE VIS
Beyond our own presentation and VISAP, we had the opportunity to attend the IEEE Vis 2025 conference as well. As I sat in multiple paper presentations, there were some projects which left an impression for how they were grounded in not just technical brilliance, but also in their principled approach.
Posterity
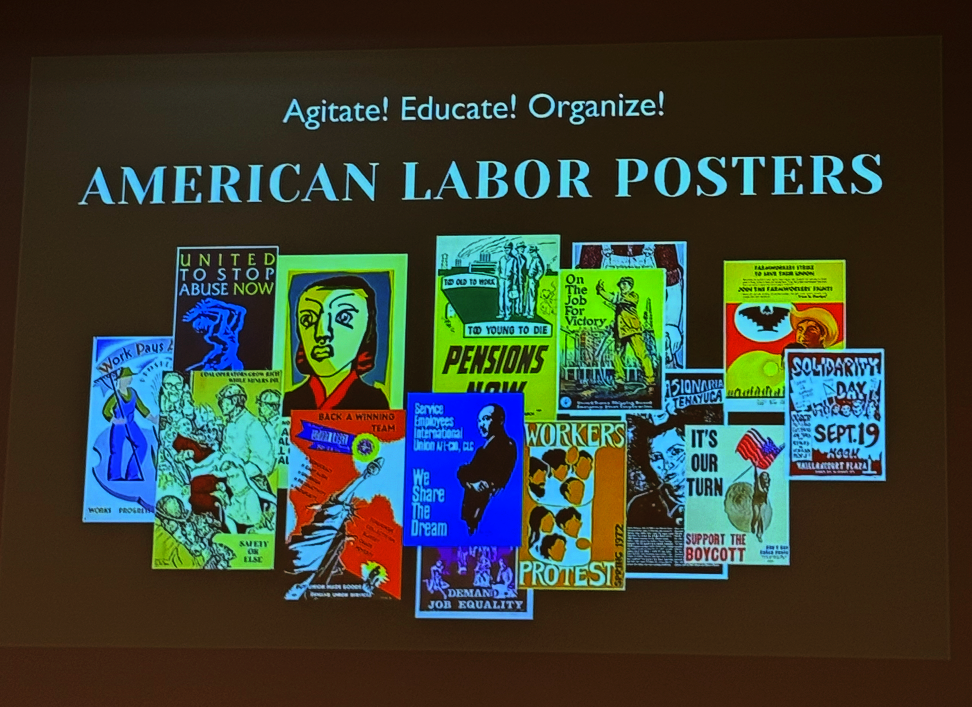
The first was Posterity, submitted under the theme Explorations in Abstract and Physical Spaces. It is an interactive visualisation system designed to explore a curated collection of American labor posters produced by Linh Pham, Daniel Rodriguez-Rodriguez , Jingfei Huang, and Hui-Ying Suk. It is a technically experimental archival project that presents posters as data in a nonlinear and exploratory manner. This method of archiving allows for fluid categorisation and shows patterns connecting each poster to another. Readers can switch between three views:
- A timeline view, which shows poster activity over time with themes and events layered on top.
- A similarity spiral view which lets users upload an image and find posters that look similar or share a similar theme, displayed in a spiral shape.
- A 3D cloud view, which lets users explore the posters in a three-dimensional space.
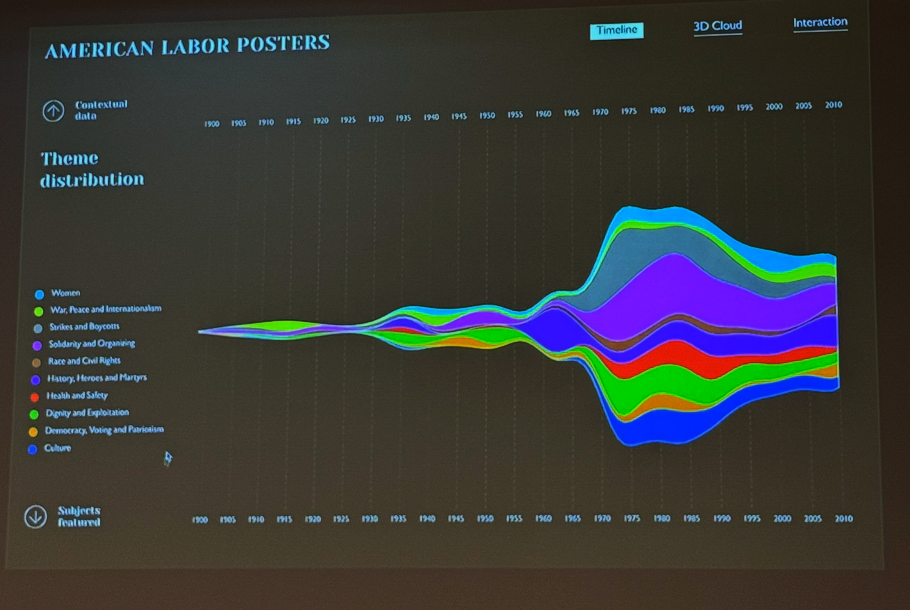
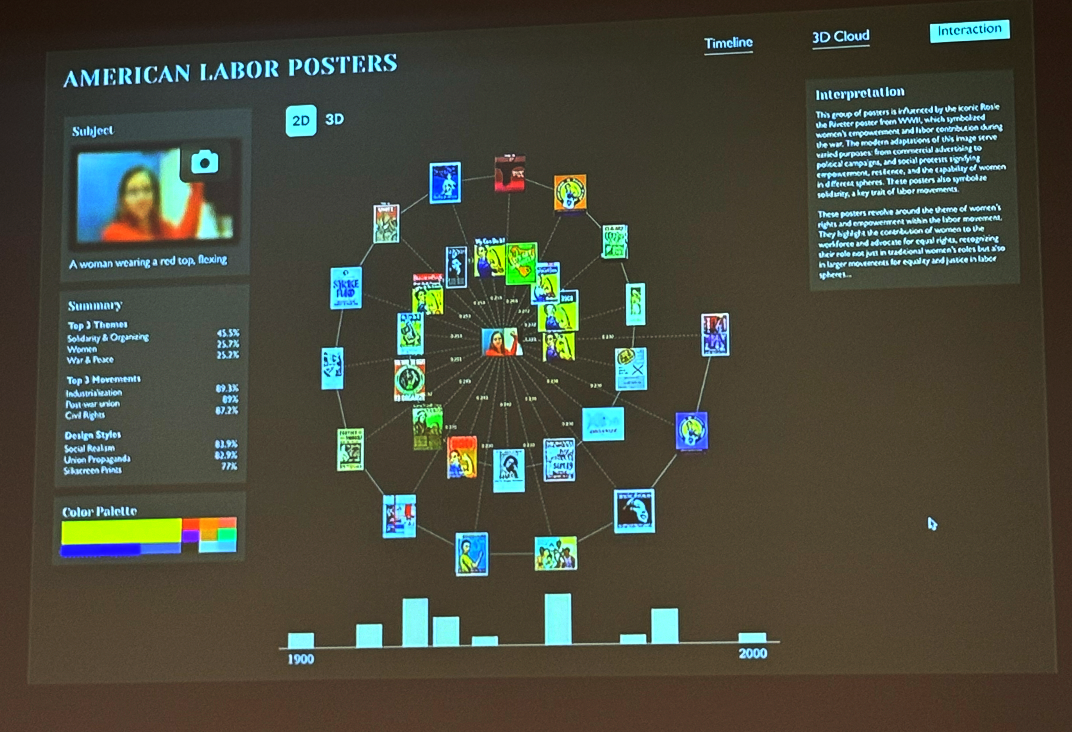
[Right] Timeline view of posters. [Left] Spiral view of posters.
This way of archiving visual data avoids oversimplifying it. Instead of guiding users through a single narrative, it allows them to explore from different thematic perspectives.
Balaton borders
Video recording of the reenactment of dining with the Data Ceramics
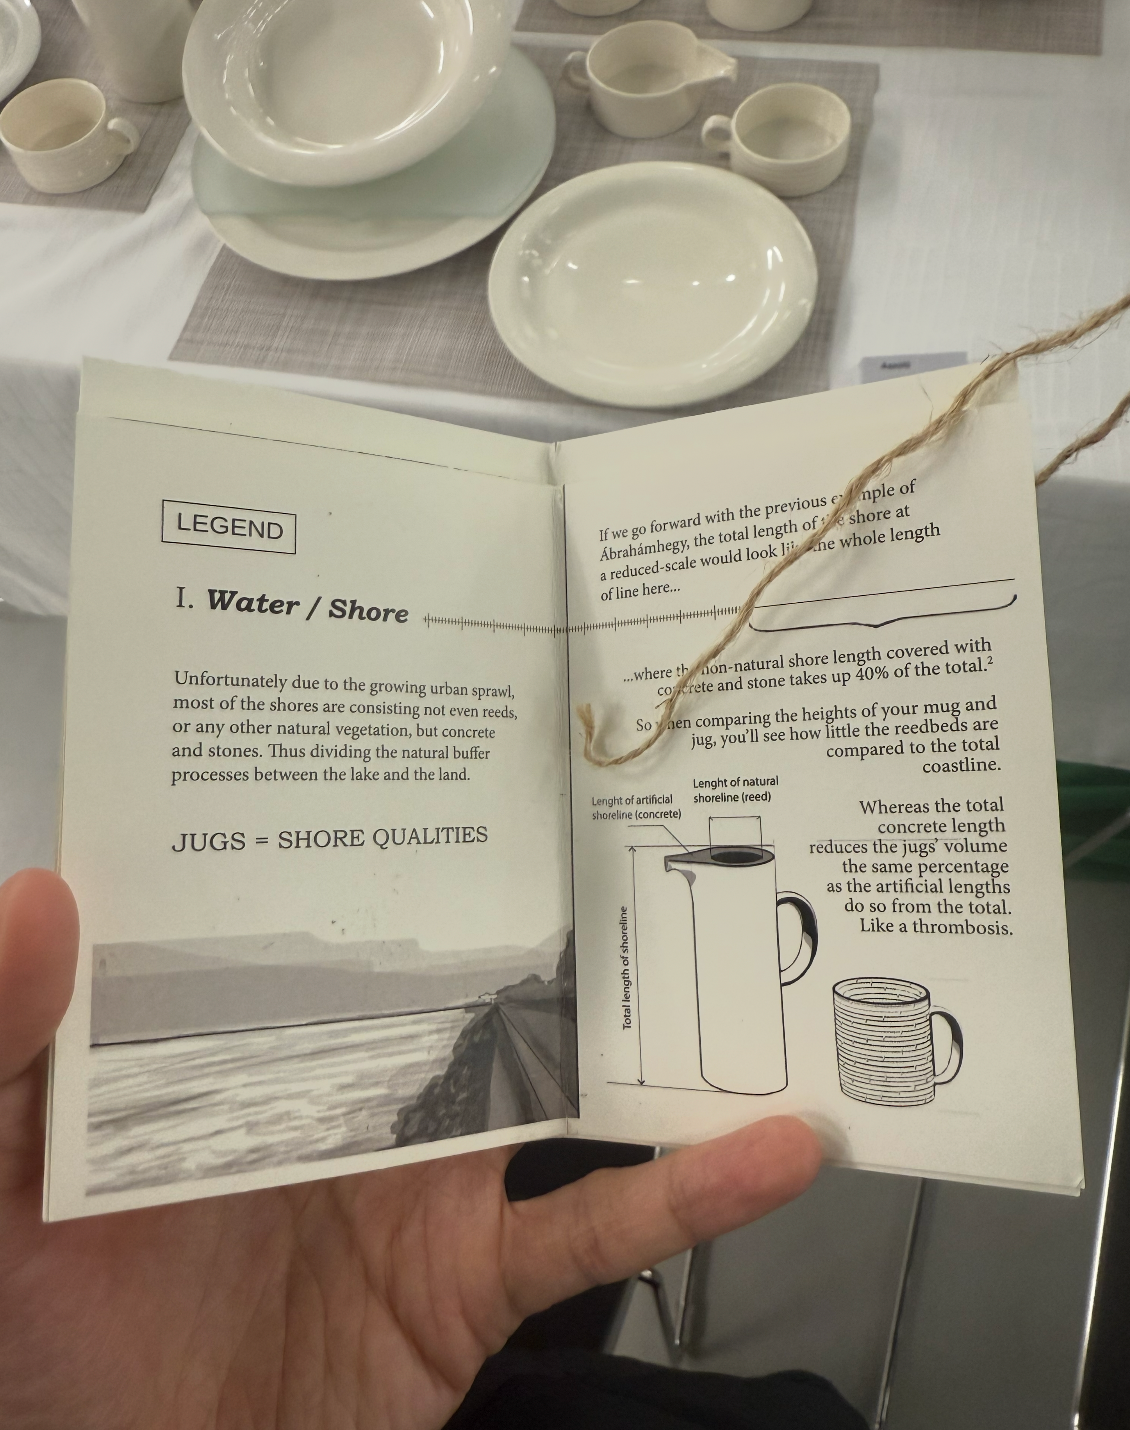
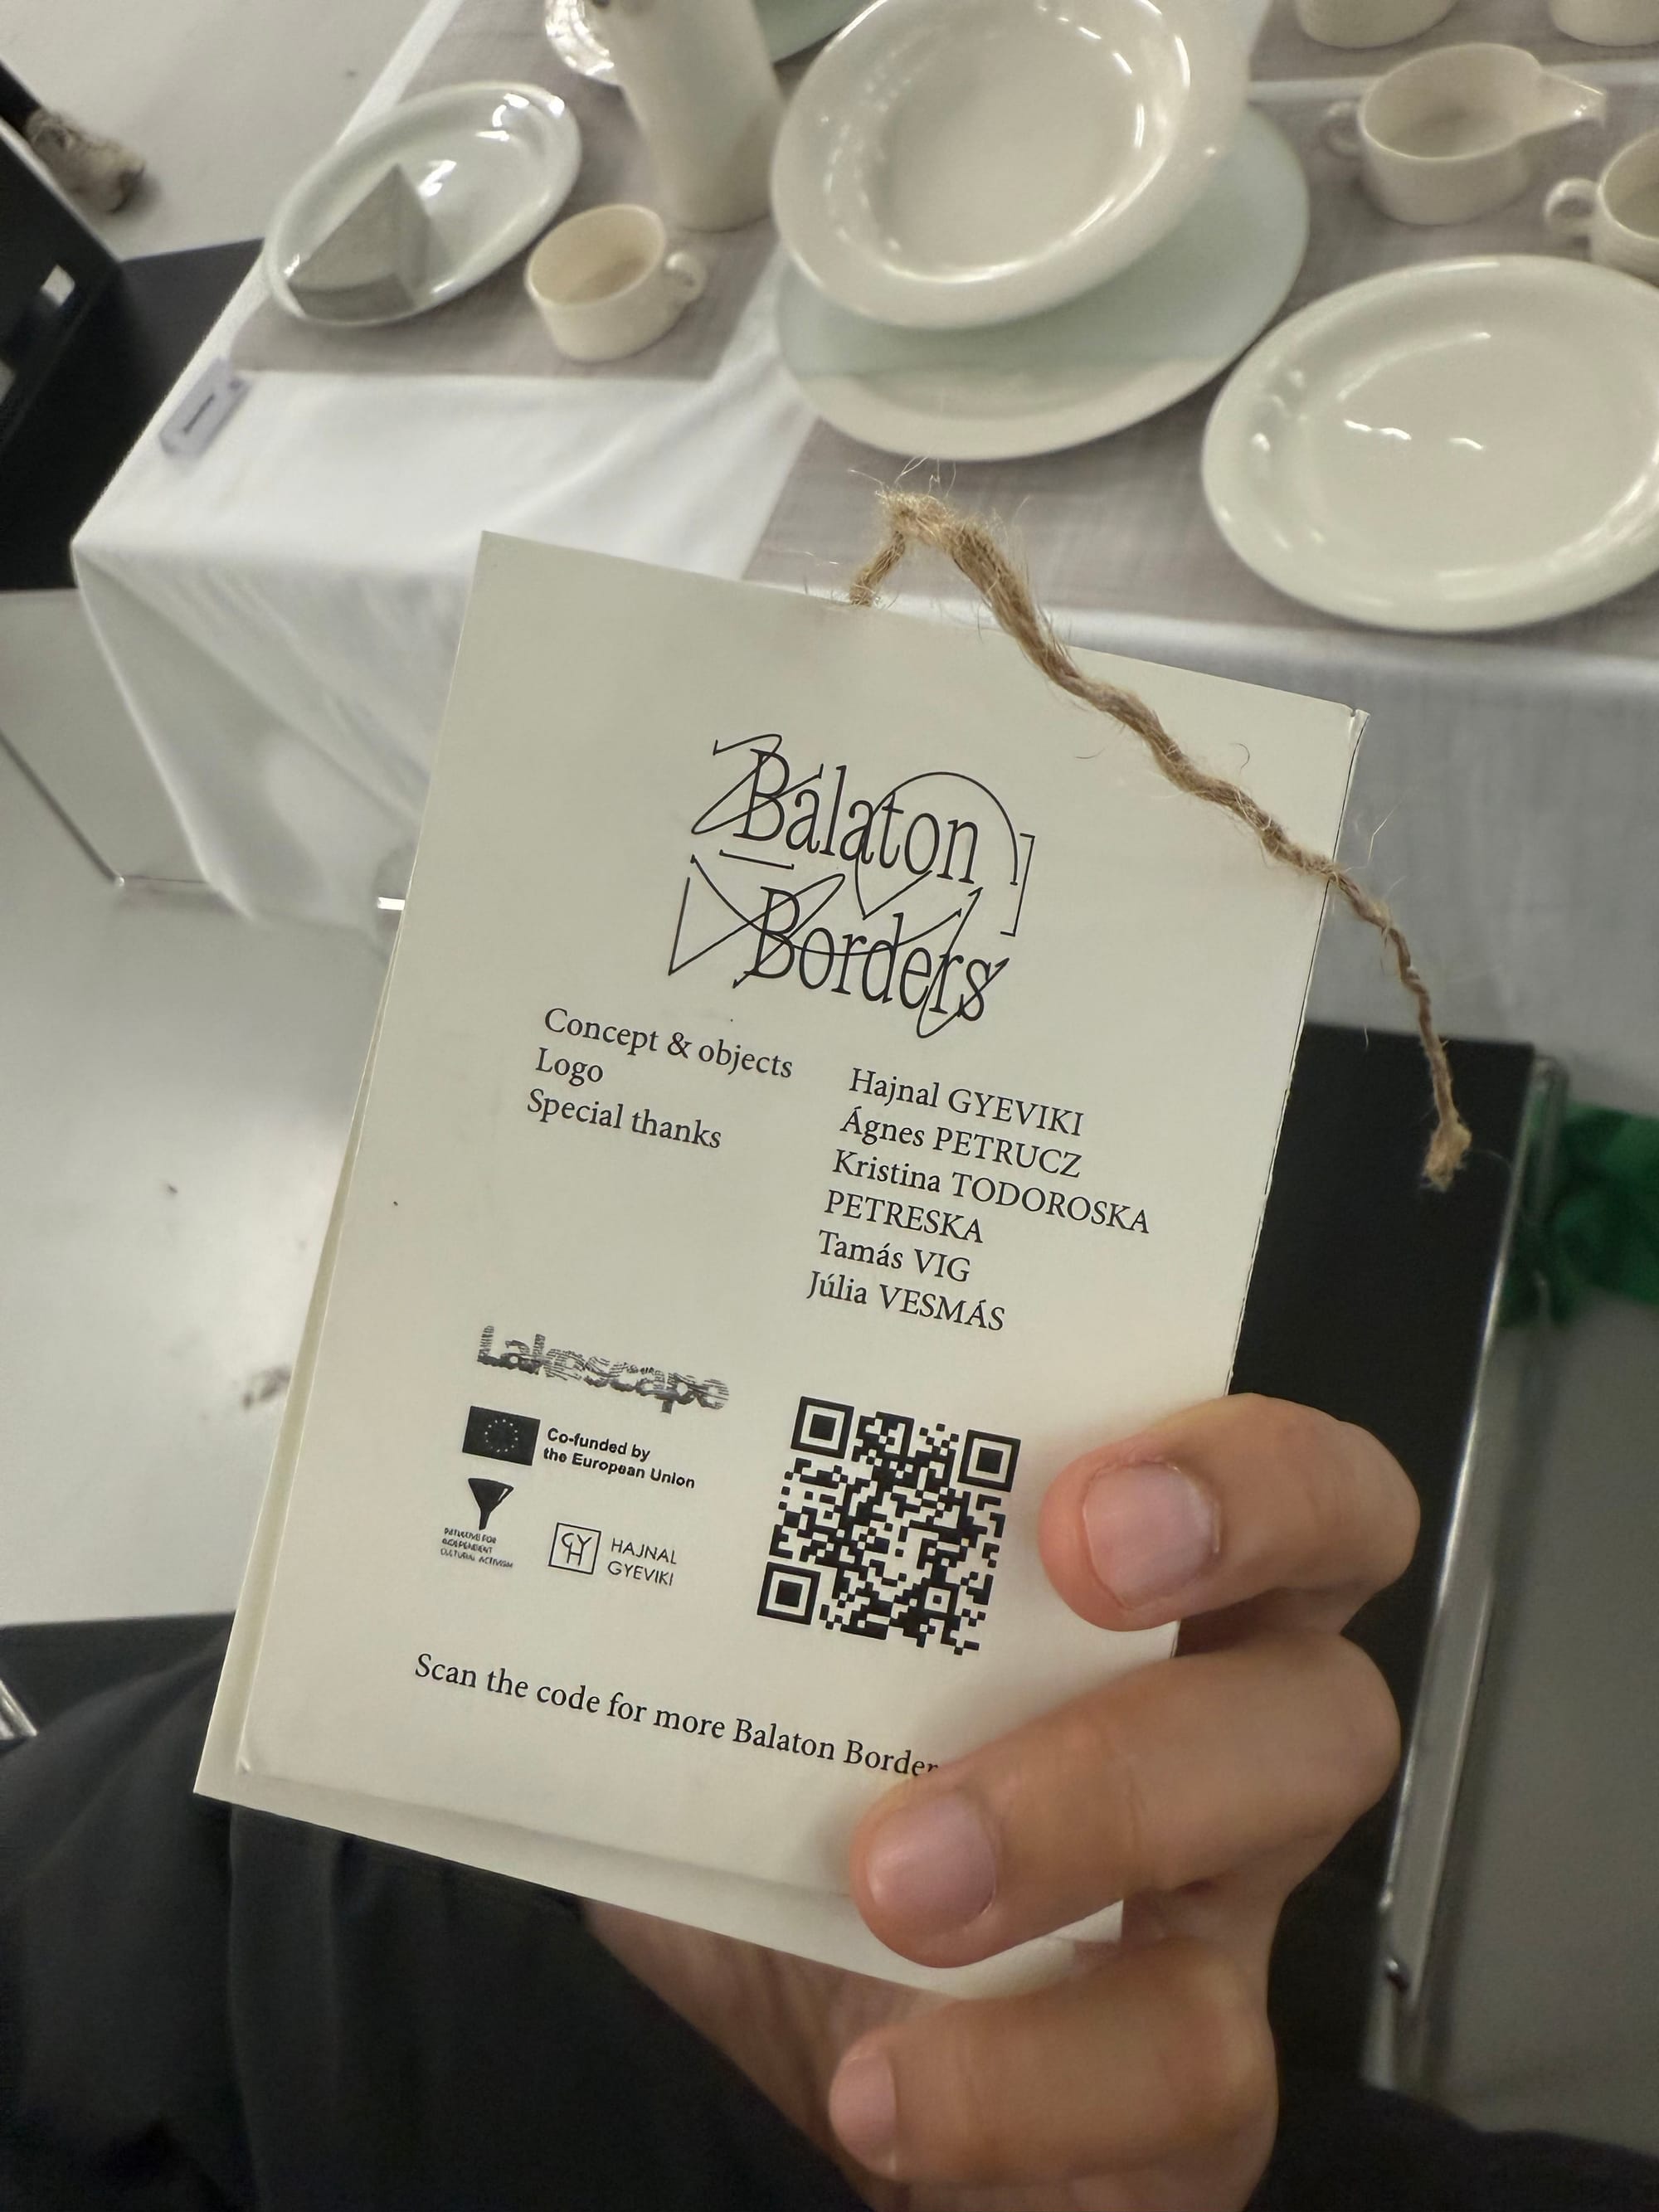
Phamplet providing details of Balaton Borders artwork
Another was Balaton Borders: Data Ceramics for Ecological Reflection, led by Hungary-based artist Hajnal Gyeviki. Aimed to raise awareness on the ecological challenges of three lakes (Lake Balaton in Hungary, Lake Ohrid in Macedonia, and Lake Vänern in Sweden), the project translates ecological data from Lake Balaton into ceramic tableware which is then experienced in a performative dining setting. Diners try to use the odd-shaped tablewares which turn meals into a sensorial experience, eliciting contemplation upon the obvious ecological disruption when they experience challenges eating. It is a visceral form of data physicalization, where loss is not just visualised but sensed through touch and experience.
Damaged leaf dataset
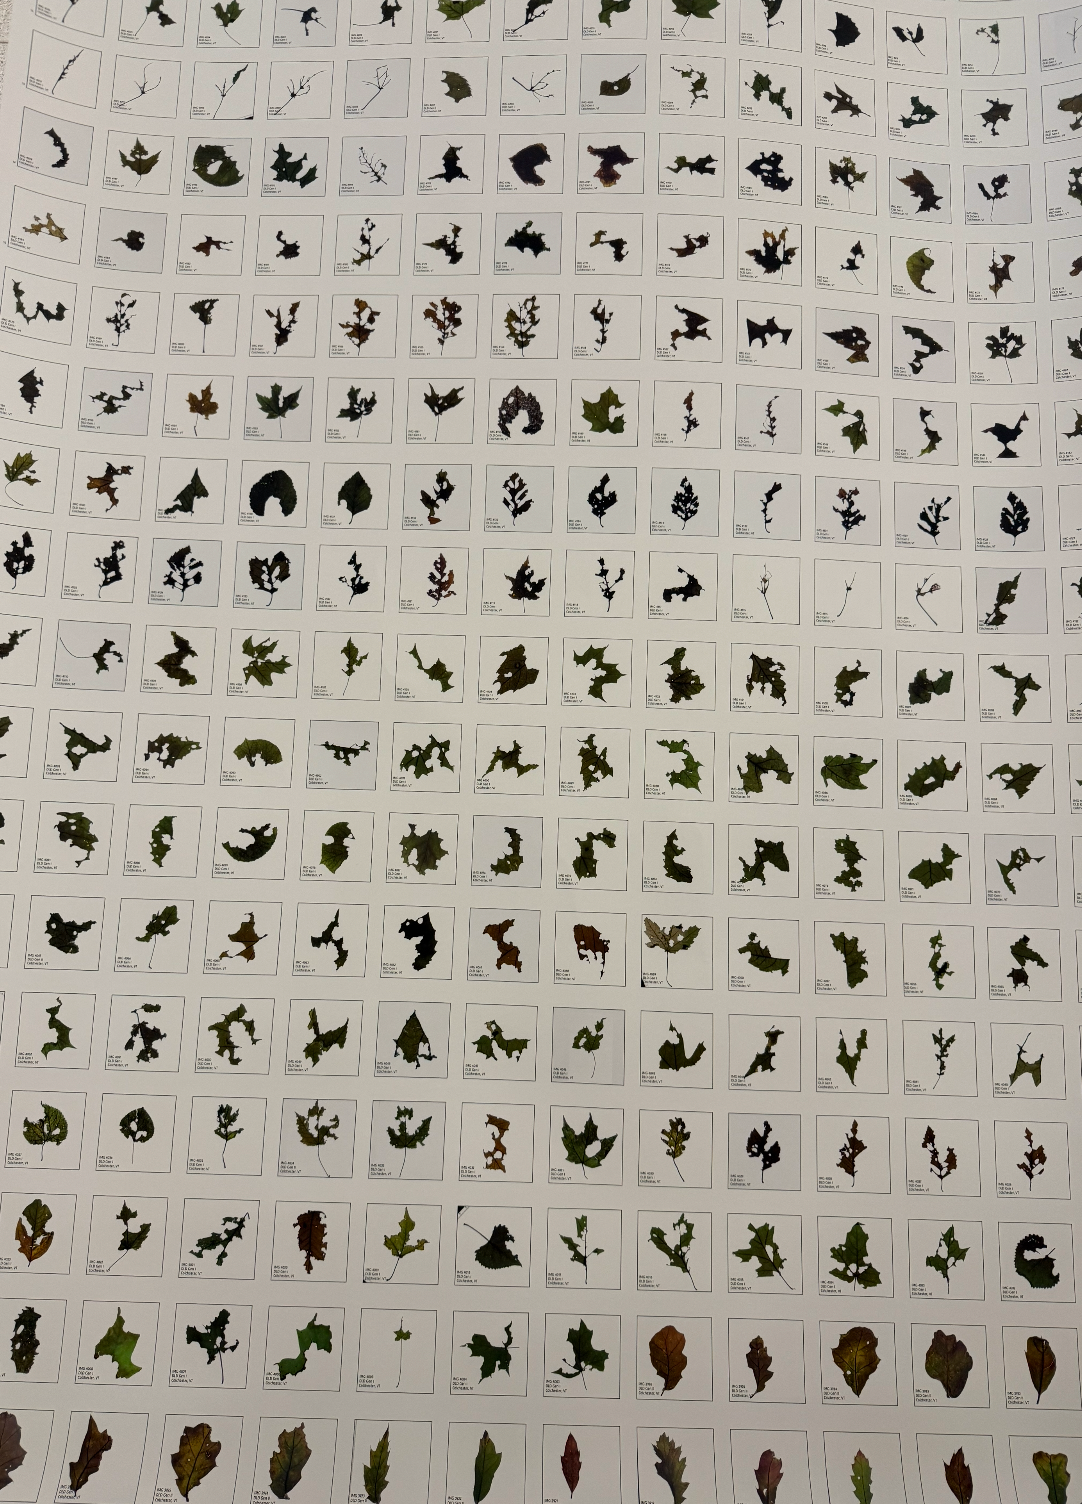
In light of the theme of loss and destruction, another project explored how data is used to ‘heal’. The Damaged Leaf Dataset by Jenn Karson explored using machine learning to reconstruct documented photos of damaged leaves. The project began with the collection of 10,000 Vermont leaves scarred by Lymantria dispar caterpillars, also known as an invasive species in northeastern US, during severe 2021 to 2022 outbreaks. The researcher–artist wanted to move beyond vilifying the caterpillar as an invasive pest, and instead highlight how the outbreak stems from an intentional introduction to the region.
To symbolically ‘restore’ each damaged leaf, the artist used machine learning trained on the damaged leaf dataset to reconstruct the missing areas of the leaf’s outer edges lost to the outbreak. It was a speculative ‘what if’ approach which exposes the loss engineered by historical environmental intervention.
Data helps us understand the world and its systems
VISAP Collective Care concluded with a keynote sharing by Kim Albrecht, a Professor of Information Design at Folkwang University of the Arts. It was a thought-provoking sharing that encapsulates what many of the presented projects were based on: that data is never neutral and that data visualisation is a mediation that helps us gain insight as to how the world’s power systems operate.
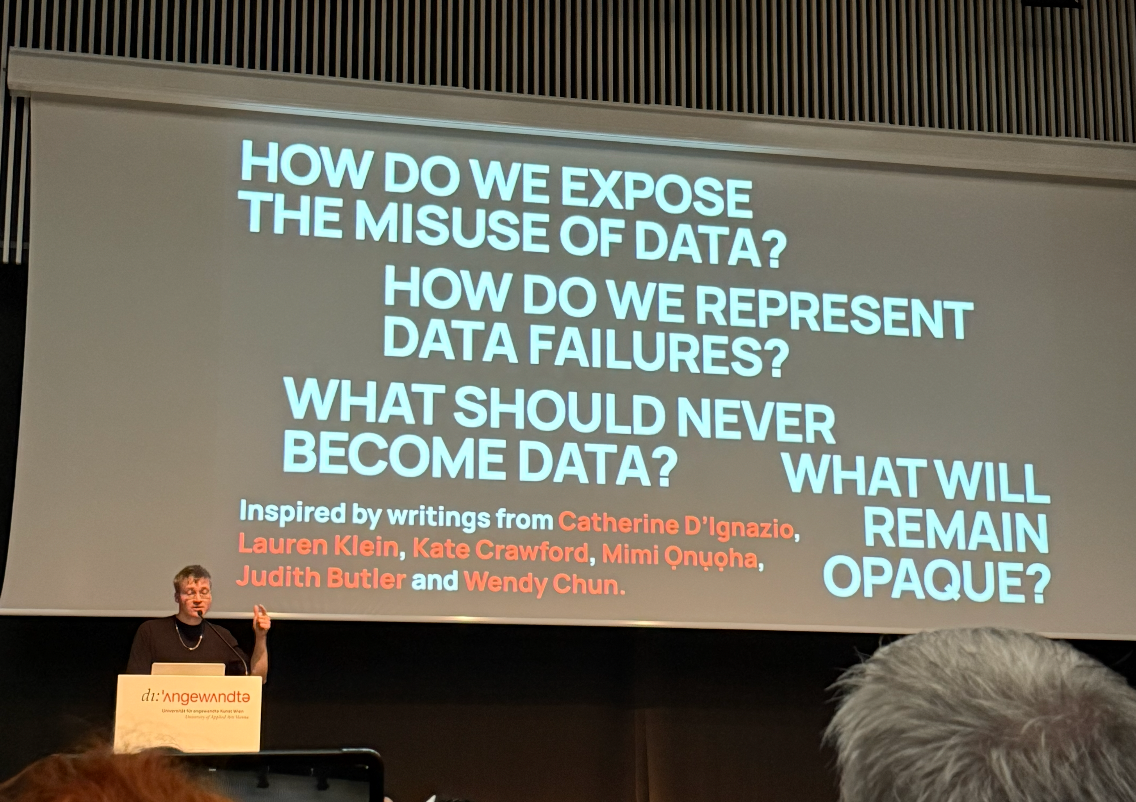
In an era where Artificial Intelligence (AI) is seemingly here to stay, data is a currency of power. The costs of running these physical data centers itself is an unaddressed systemic issue: Indigenous, local communities, and the environment are disregarded by large corporations as natural resources are extracted to run and build data centers. There’s also dubious guard rails on data privacy and usage, which meant increased surveillance for usage in authority and military complexes. The immense impact AI has on the economy and workforce, and without any accountability in place means many are at risk of losing out to automated workflows, leading to wider income and wealth gaps. This all makes it all the more our responsibility as data practitioners to uncover what data conceals, what should never become data, and to expose how it is misused and extracted.
Professor Kim Albrecht in the midst of the keynote
Practising our data principles
The keynote was a sentiment that echoed in the reflection of our works. Much too often, data practices treat communities as sources to be collected and examined, an “Othering” practice that exists in tandem with colonialism. Academics or well-meaning civil society individuals and groups study Indigenous groups as a source of fascination and discovery, but rarely include or consult them in crucial decision-making processes. These published papers and data also frequently do not add materially to the lives of Indigenous communities. To do our best in avoiding this, we disciplined ourselves with a community manifesto that grounds our methodology in mutuality and solidarity rather than extraction, and that embraces diverse voices and lived experiences.
One of the ways was connecting and collaborating with Orang Laut SG, advocate of Orang Laut and the seafaring communities of region. We co-designed with them for a participatory exhibition for Hari Orang Pulau, where we co-designed with Orang Laut SG in establishing the approach and transparency in who the data collected during the exhibition belongs to.
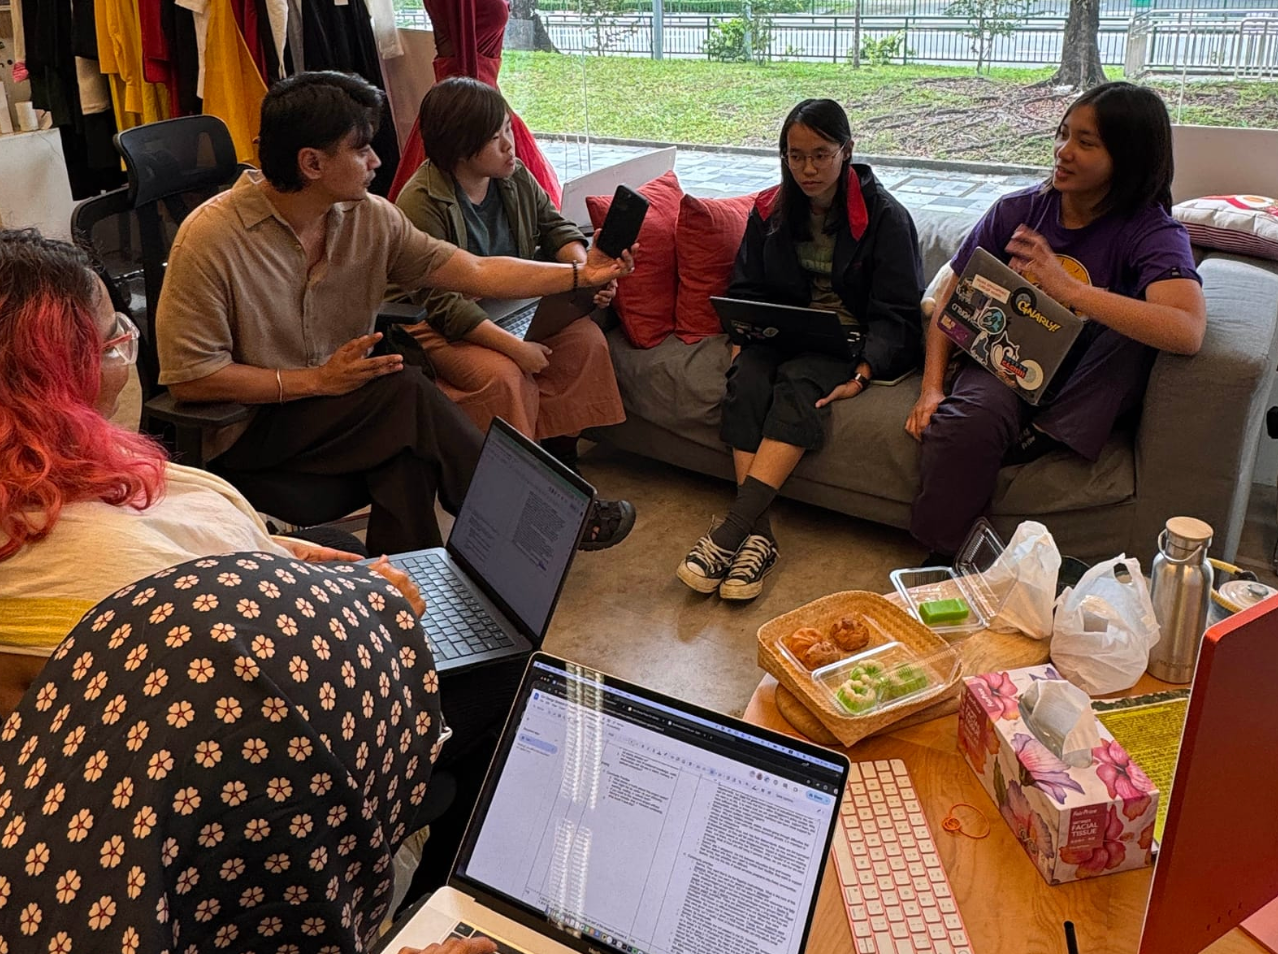
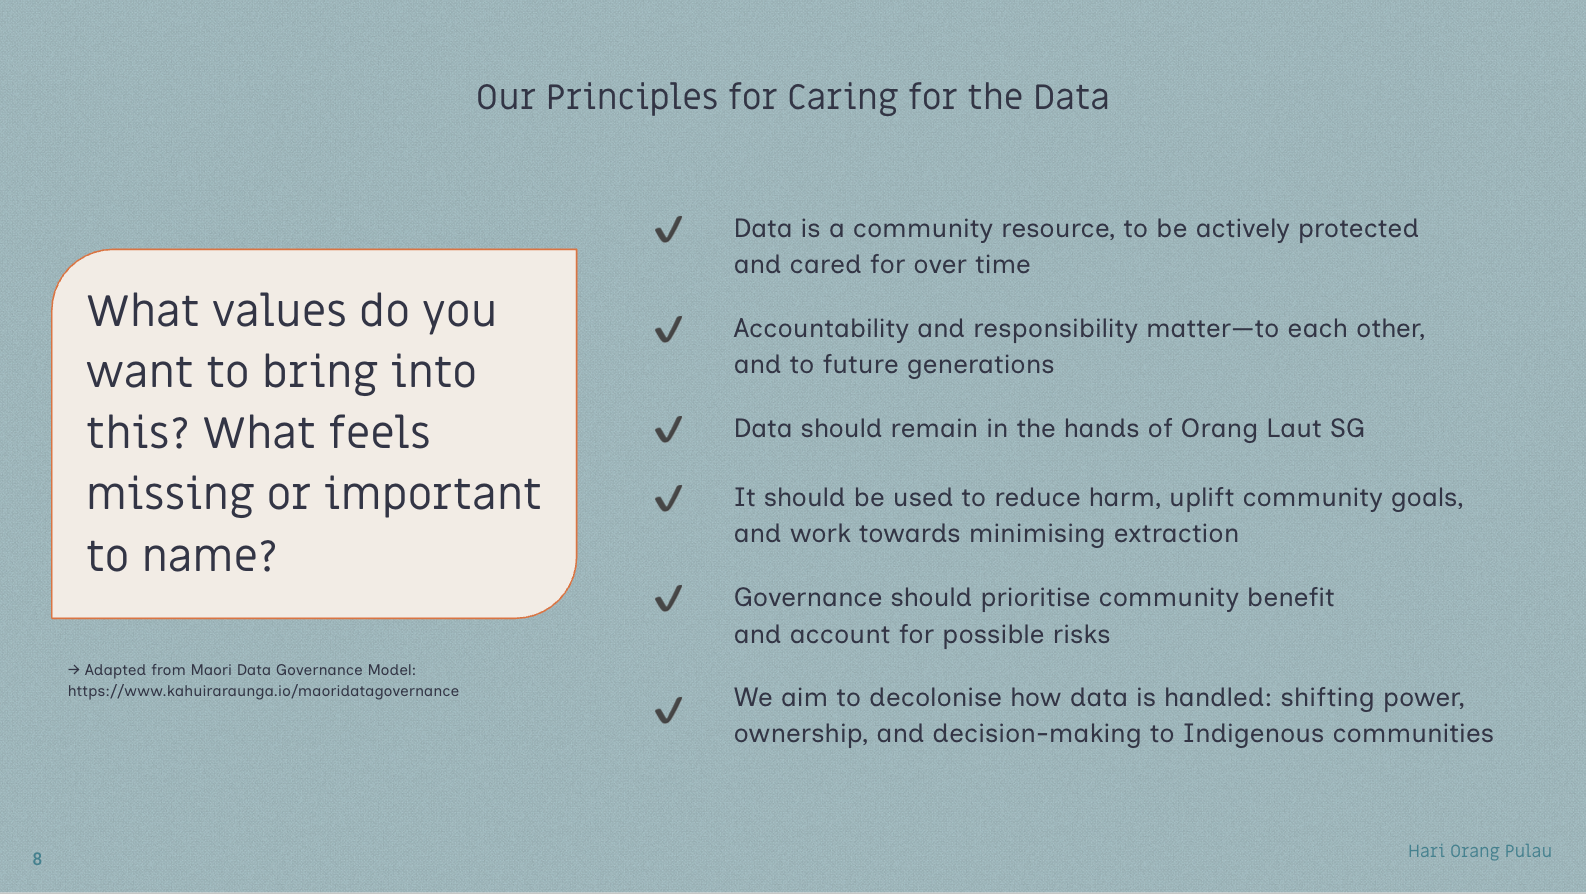
[Right] Co-design session with Orang Laut SG. [Left] Snippet of the slide compiling principles of data governance.
In The Hidden Green, a wall exhibition project for The Everyday Museum, we exposed how static datasets have unrecorded swathes of land and trees due to administrative purposes and non-native species were a legacy of British colonialism. In response, we included a restorative experience where we referenced Indigenous perspectives of nature and specific trees, and included tactile and audio specimens where the reader can experience beyond numbers and infographics.
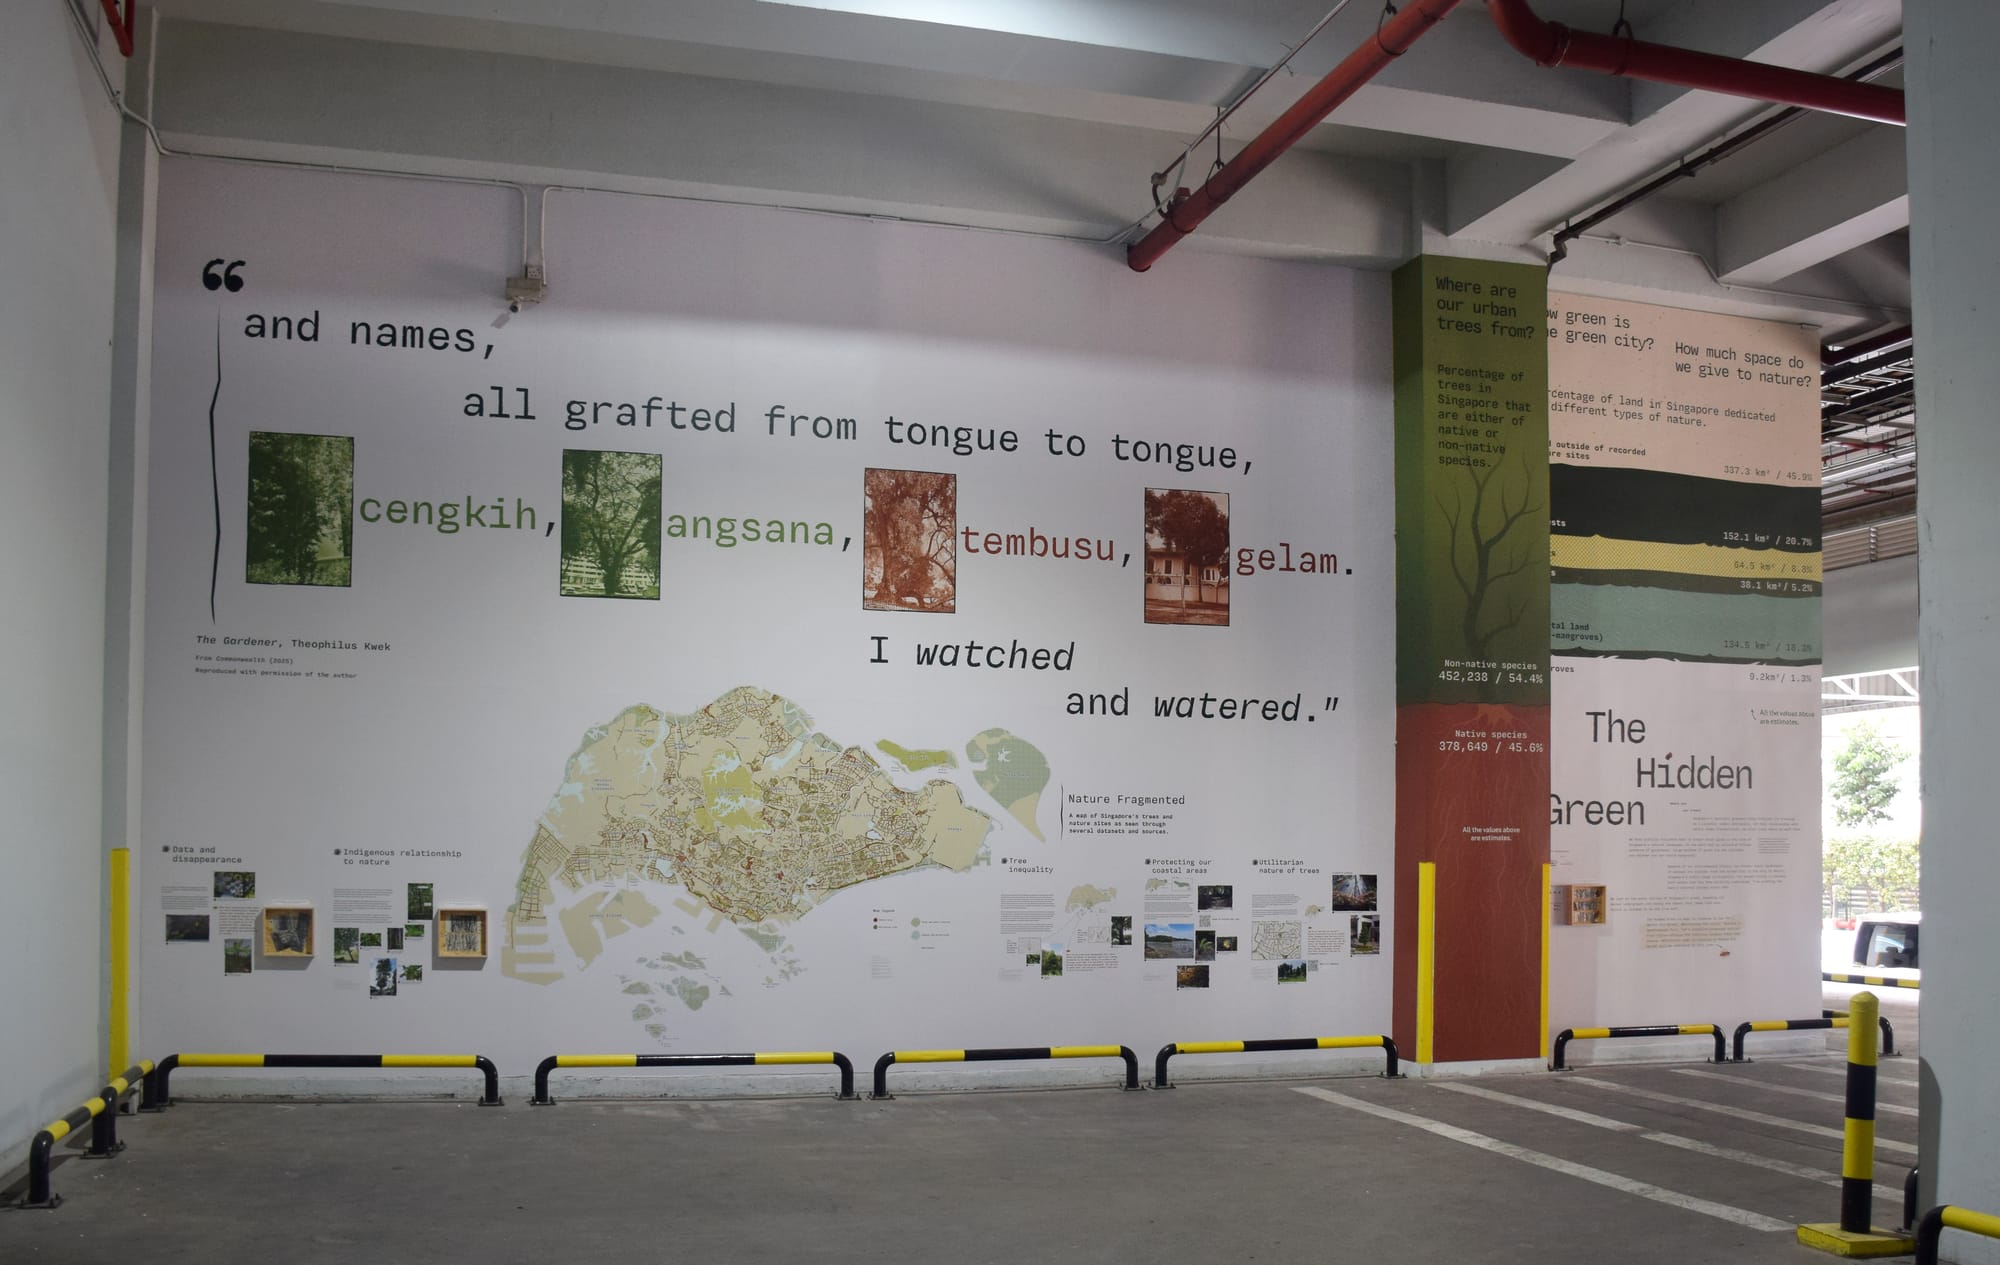
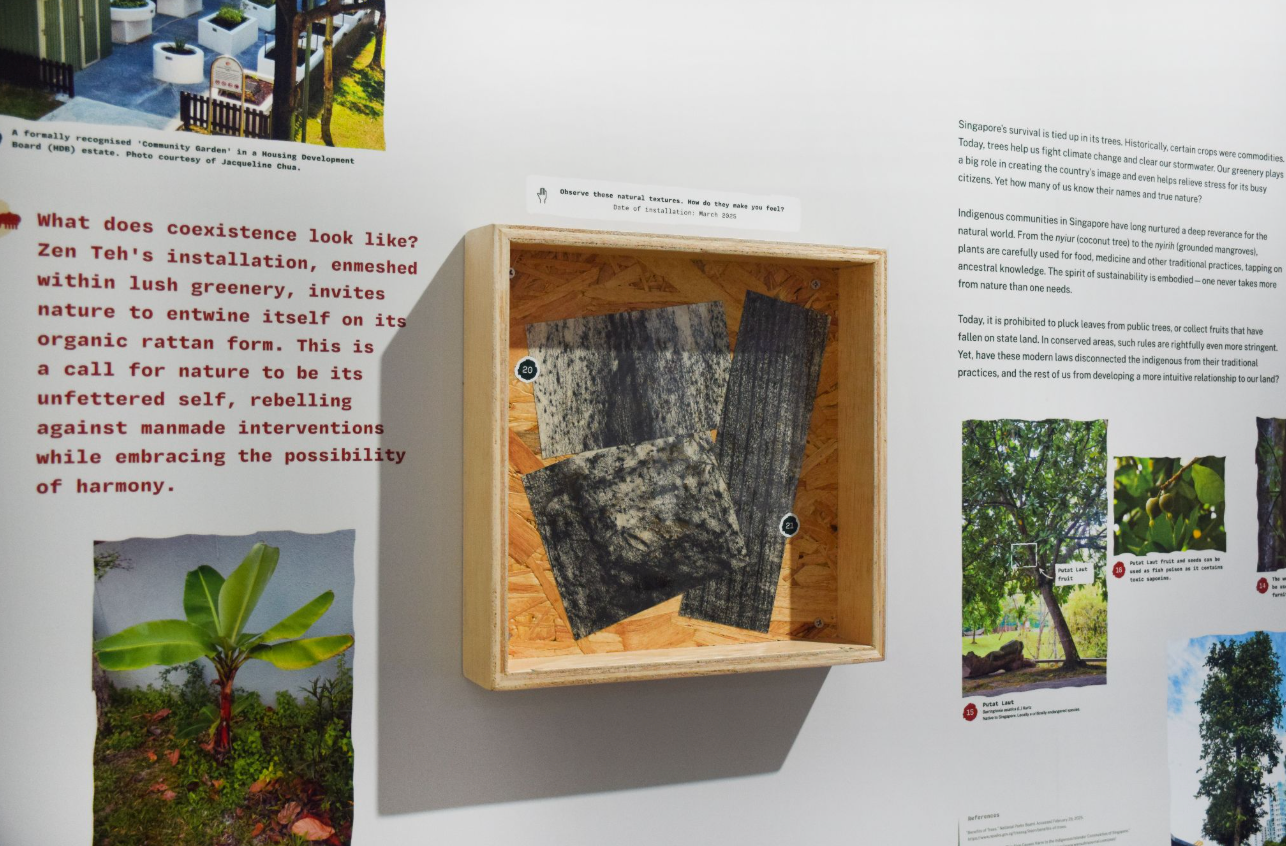
[Right] The Hidden Green infographic display at Singapore Art Museum. [Left] A close snapshot of The Hidden Green exhibition wall, featuring the tactile component where visitors can touch and view the documented textures of a tree.
In Gaza Lives: Resisting Cultural Genocide, instead of repeating the mainstream narrative of demise and destruction, we highlight historical and material value of sites through Gazan artist eyes. The intangible memories are mapped using personal photos, cultural motifs and illustrations to tell their stories with dignity while also celebrating the artist’s craft.
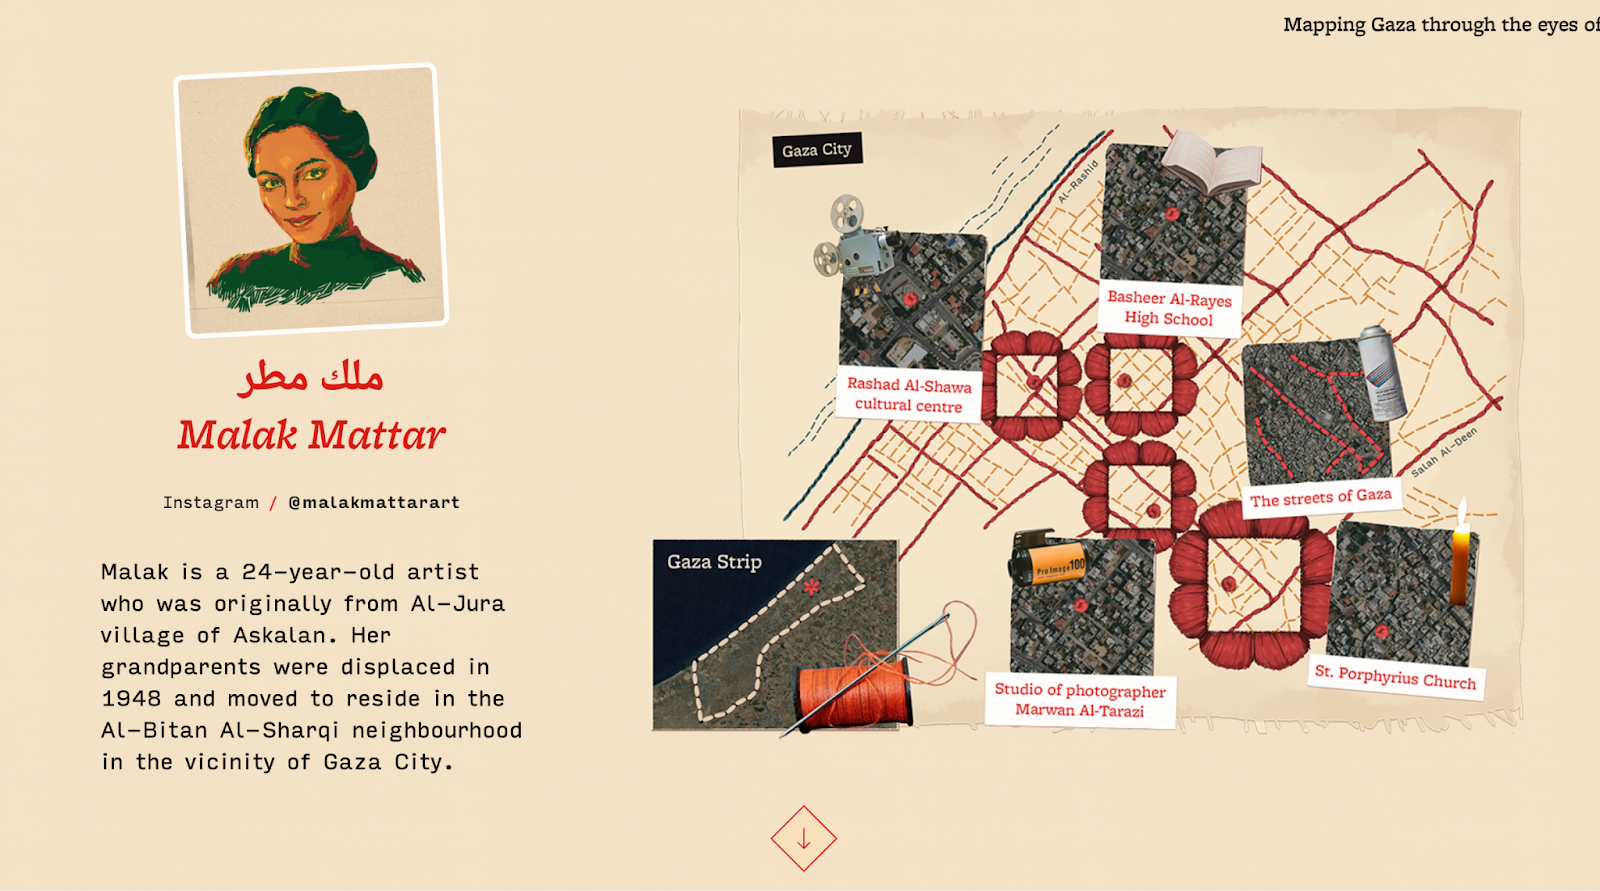
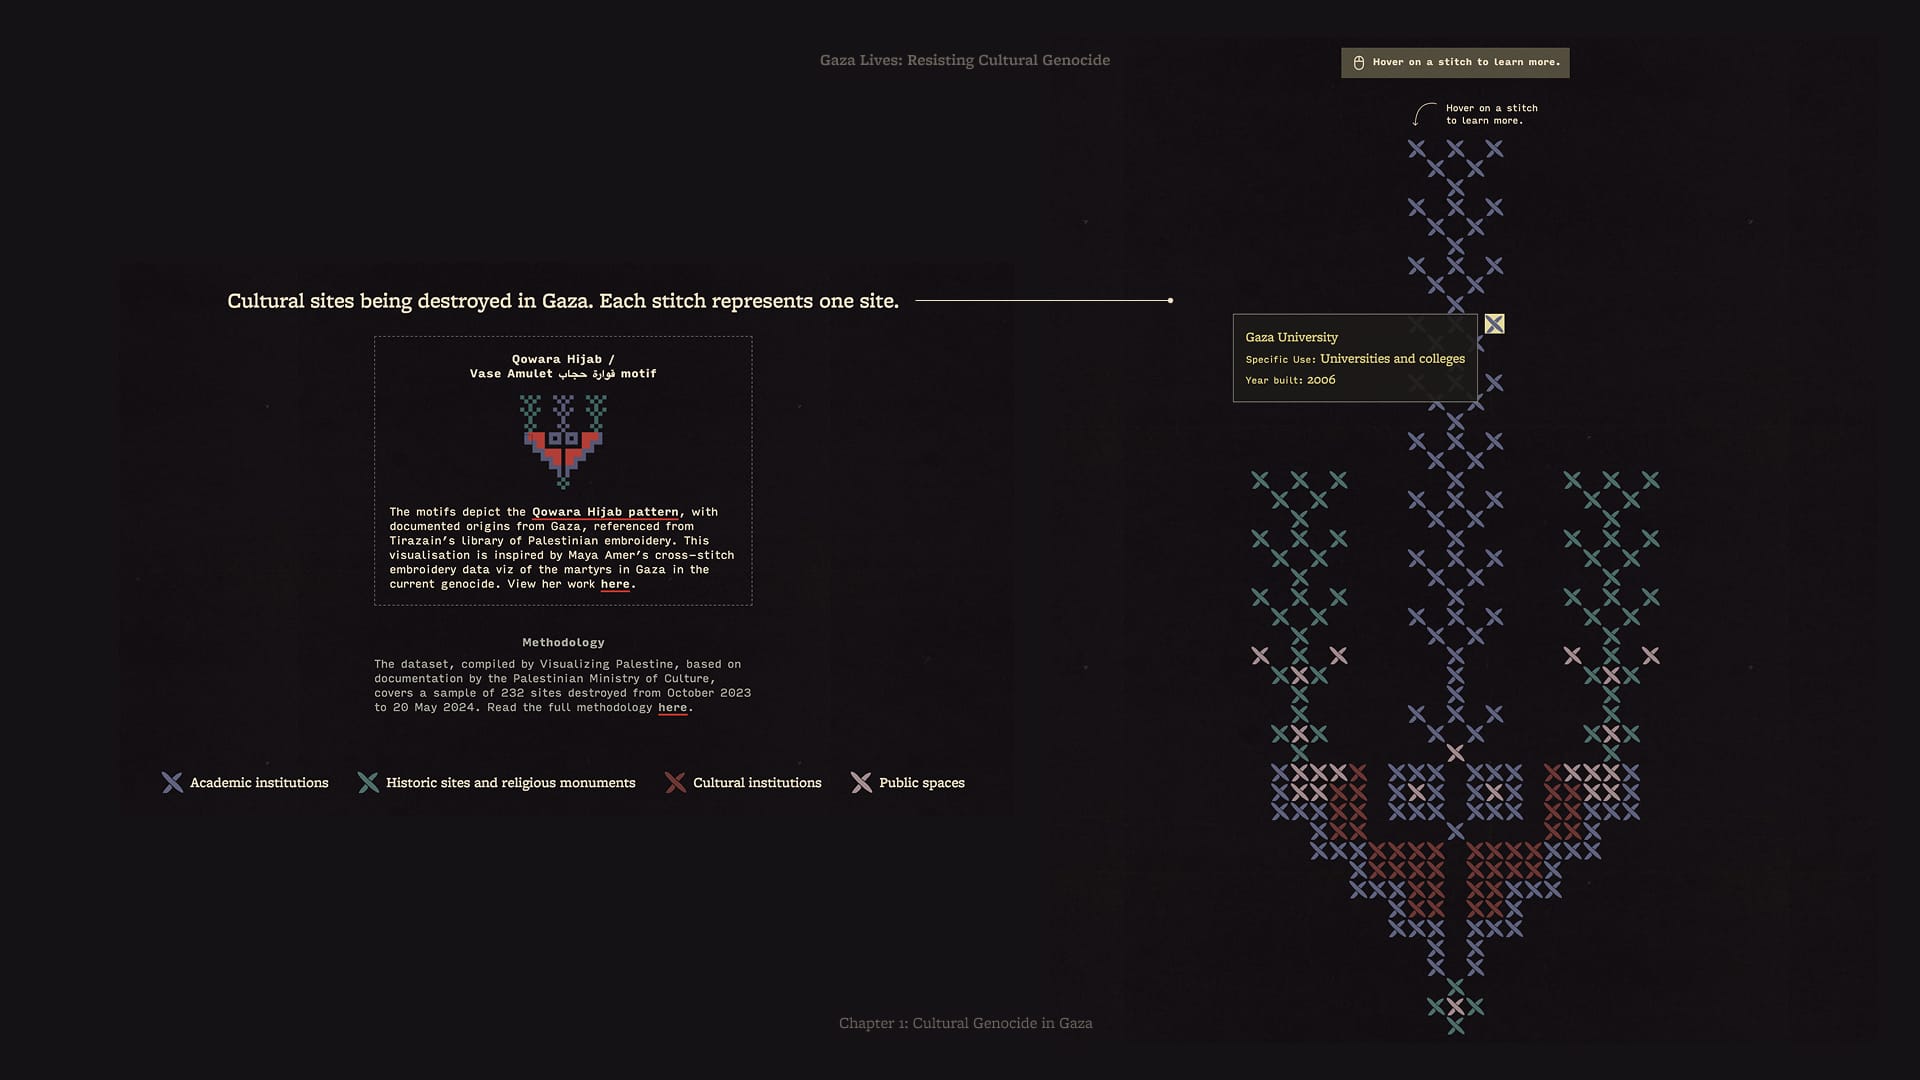
[Right] Screenshot from Gaza Lives Chapter 2, which features Gazan artist Malak Mattar and her memories of Gaza City. [Left] Cultural sites represented as tatreez motif.
Moving forward with care
Returning from the conference felt like re-entering our studio with a wider perspective and solidified sense of purpose. These reflections and sharings particularly motivate us to keep exploring and reimagine how data can be represented and visualised, particularly within storytelling. It's important to think beyond our own technical expertise and practice when working with data. We should not always conform to a binary process or fallback to a rigid form of representation; handling data can vary depending on its nature, the limitations, but more importantly, to continue a legacy of care when engaging with communities.
Some resources on how we can care with data:
- Data-driven projects which showcases techniques designed to show emotional impact https://numbers-meet-empathy.org/
- Indigenous-centered toolkit from the Maori approach https://www.idia.nz/toolkit
- Decolonising Data Visualization—Visualising Postcolonies https://infovis.fh-potsdam.de/decolonizing/
- Open collaborative archive of online data visualizations which explores alternative narratives https://alternative-narratives-vis-archive.com/