
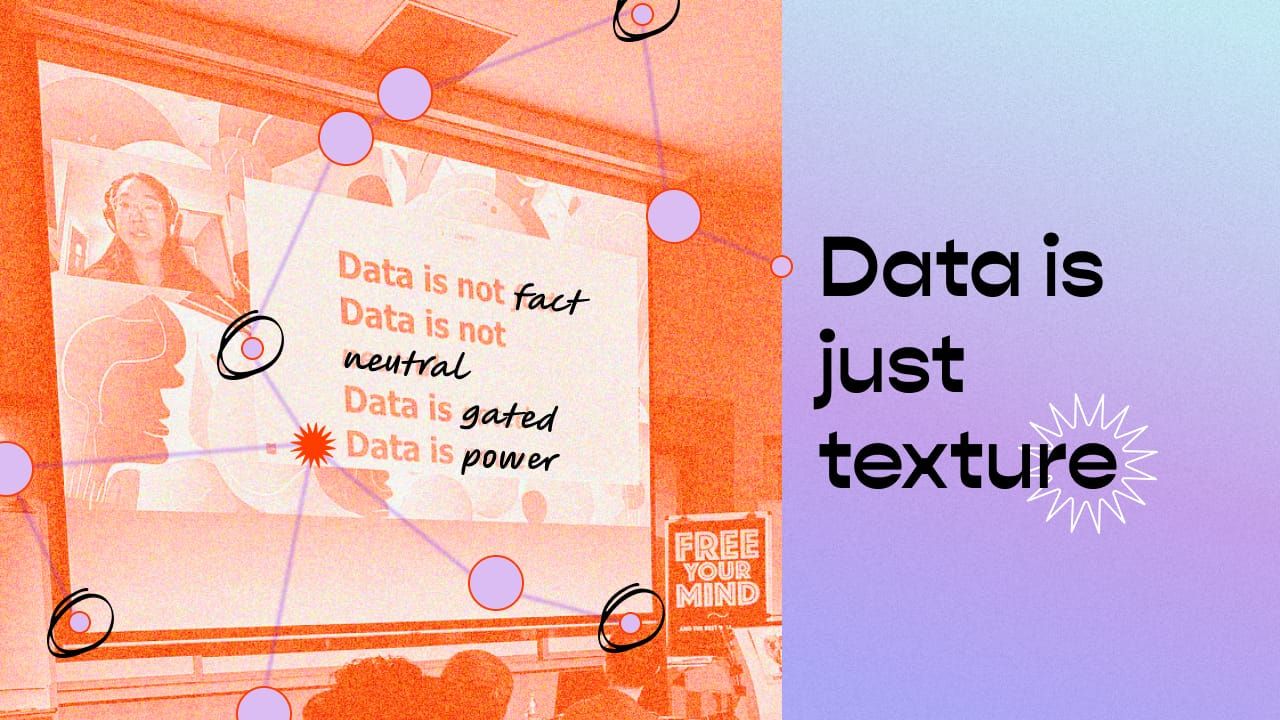
Data is just texture
How can we develop a more intentional approach, methodology, or manifesto around our perspectives towards data? Particularly, how do we think of it ethically, countering eurocentrism whilst applying a feminist and decolonial approach?
Since February, the Kontinentalist team has been having conversations about what our next steps are in this AI- and data-obsessed future that our society is hurtling towards. How can we develop a more intentional approach, methodology, or manifesto around our perspectives towards data? Particularly, how do we think of it ethically, countering eurocentrism whilst applying a feminist and decolonial approach?
Earlier this month, I got the opportunity to share our still evolving thoughts on this at Academia SG’s Knowledge Praxis conference, the first of its kind that is aimed at expanding the boundaries of knowledge production in Singapore. Below is the full text of my segment for the “Data, Data Everywhere…” panel that was held alongside Sociologist Shannon Ang, Historian Loh Kah Seng, PhD Candidate Neo Hui Yuan, and Melvin from the Migrant Death Map Team, moderated by Senior Research Fellow Ng Kok Hoe.
My sharing today will be a bit of a combination of Kontinentalist’s methods and approaches towards data, but also a little of my own learnings as a MSc student in the University of Edinburgh undertaking a course on Data, Inequality, and Society. I have quite a few slides and ideas to share, so please bear with me while I go through these relatively quickly and briefly.
First let me introduce a little about Kontinentalist. We are a data-driven publication and editorial studio with an explicit mission to centre Asian voices and stories, countering eurocentrism and western bias. Our approach to this is grounded in data, because we believe it to have strong persuasive qualities. It operates with believability and empiricism, and has the ability to get people of differing or even opposing views onto the same page. Particularly we love it for its myth-busting qualities, and its ability to take conversations out of an anecdotal realm to a more concrete footing. So, we strive to be a bridge between the research sector and the public, and we use intentional information communication and design to ensure the data is well communicated and accessible.
But as we obviously know, data is not neutral. It is often gated and wielded by those with power for their agendas.
There is a tendency for us to think of data as an idealised form of knowledge—that it is reliable, accurate, correct, and true. In our everyday language we would often ask, “do you have the data for that?” as a way of fact-checking statements, justifying our arguments, and so on. There is also an unspoken belief that it somehow deeply reflects reality, and in many ways it does, even in how it encodes societal bias, discrimination, and inequalities.
While Kontinentalist holds this view of data, we also recognise the importance of humanising it. Here I have three concepts that I would like to add to today’s conversation on how I think we should shift our understanding and use of data.
The first is from Johanna Drucker’s landmark paper on Humanities Approaches to Graphical Display, which introduces to us the concept of data as “capta”. She suggests that data aren’t items observed but rather captured, actively taken and constructed. It is “an interpretation of the phenomenal world, not inherent in it”. When thinking of data as “capta”, it also brings to mind the inherent power dynamics of data collection, asking the important questions of who is doing the collecting, and what is being collected. Her argument of data as “capta” also helps us see how data can be extremely reductive, especially so when put into information visualisation. We see many responses to this of late with the atrocities in Gaza, in that no matter how hard one tries to visualise the scale of death, it all seems to reduce something horrific into a single statistic or image that makes loss more digestible for our comprehension.
The second is the concept of data-bodies by Terrie Lynn Thompson, which helps us draw an explicit and deliberate connection between data and physical bodies. She argues that thinking of these two things together helps us understand data and bodies as co-constituted lived practices that turn into becomings. Data-bodies help us understand the inseparable and symbiotic relationship that we’ve developed with data, especially big data, in how we wield it and the ways that it influences us in return. It draws a visceral relationship between what is quantified to its material impacts on human life.
The third is data humanism, a manifesto developed by famous artist and designer Giorgia Lupi, on how we should approach data, and create data visualisations that viewers can relate to. She stresses again, much like Drucker, that data is merely a snapshot of the world, the same way we take a photograph on our cameras. They are simply placeholders, and fleeting. To operate and wield them as hard facts is forgetting that data is simply texture, and does not show the complexity of life and our world. She says in her essay:
“It’s time to leave behind any presumption of absolute control and universal truth, and embrace an informed depiction of the big numbers and small imperfections that work together to describe reality. And data visualisation should embrace imperfection and approximation, allowing us to envision ways to use data to feel more empathic, to connect with ourselves and others at a deeper level.”
Lupi’s clarion call to draw attention to the imperfections and uncertainties of data seemed to go against the popular notions of data as being “objective”. Data is now as valuable as gold, and is used to formulate policies and justify decisions, yet very few question its integrity, and we generate thousands of charts, graphs without further questioning of what this does to our understanding of humanity and life. Her article has pushed us to think: how can we make data more visceral for our audiences?
Kontinentalist is still exploring and developing our own methodologies and responses to these issues that plague data and its challenges. But here are some approaches we’ve been experimenting with, and a general ethos that we apply to our work.
Here is a quick rundown of five things we practise, but this is not exhaustive.
#1 Centreing stories
Abandoned at sea: The desperate journeys of Rohingya refugees
Kontinentalist always stresses the importance of humanising data with stories and empathy, which is why our publications use multimedia visual storytelling as our default approach to bring our readers through the ins and outs of a data investigation. We supplement our work with a lot of qualitative information, adding audio clippings, voices, images, and illustrations, to ensure stories remain about people.
#2 Adopt a healthy scepticism of data
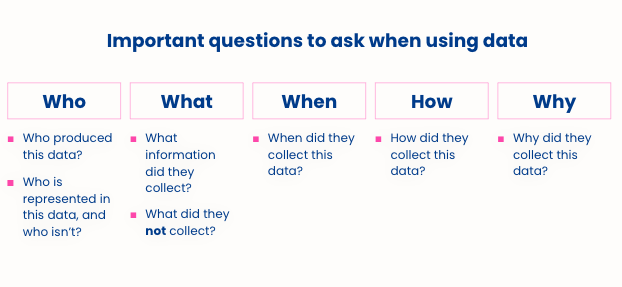
We ask your classic who, what, when, how, and why questions. Who is producing this data and do they have business doing so? Does the data tally with our understanding of reality or does it raise suspicion? What is said or not said? Who represents and who isn’t? Is this a story or topic where data should even be part of the conversation to begin with?
#3 Encourage an expansion of what constitutes data, and what is credible and reliable
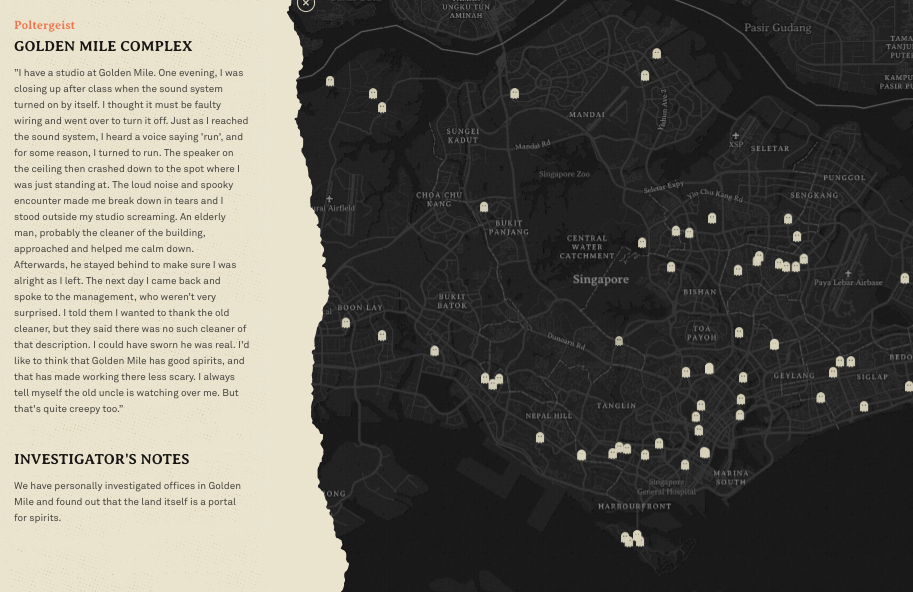
As we’re probably familiar, myth and mysticism are not simply beliefs in much of Asia but understood as realities. We’ve worked with cultural groups to data-fy some of these, such as exploring a distribution of ghostly confessions on a spatial map. We also reject the notion that things must be necessarily empirical for conversations to start, and instead focus on representation and availability. In one story for example, we used Ramen Rater’s list to inform our understanding of the shared love for instant noodles.
#4 Think intersectionality also helps with ensuring that we apply a feminist and humanist centred approach to our data and stories
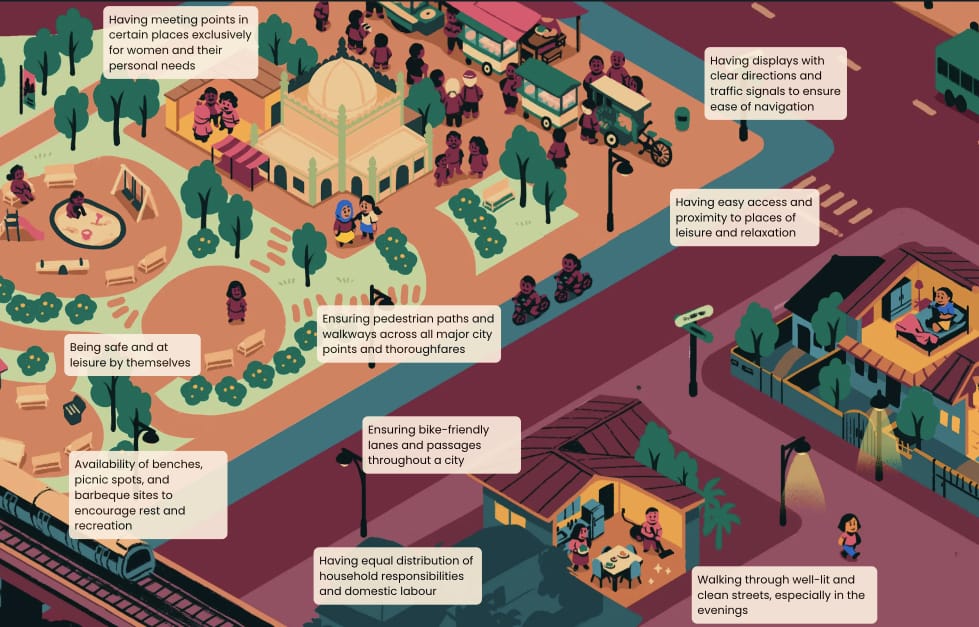
In a recent story discussing women’s leisure and rest, we understand that women have varied experiences depending on the city, families, and situations they are in. Instead of simply sending out a blanket survey, we made a culture-centred approach to understanding this question and collaborated with 12 different organisations to conduct interviews across several cities, talking to women across a wide spectrum of incomes, to understand shared and differentiated experiences. We looked at not just income, but multiple factors such as distance, transport options, and spaces to have a full picture of what’s required for leisure.
#5 Leverage community
We reject the notion that in order to make meaningful commentary, data has to be somehow collected comprehensively, in accordance with statistical rules and guidelines. This is limiting, and raises the barriers to entry for those less resourced to engage in conversations. We also believe in the power of data activism and counterdata as we have seen with the migrant death map project, but also that leveraging the power of community, we can take the power back from structures and institutions and make our own meaning with whats available, as we did in these stories about climate change and sexual violence in Singapore.
I thought it might be useful to end this sharing with some questions that the Kontinentalist team have been pondering, and have set as challenges for ourselves on the road ahead. How do we represent data that we have no language for? How do we represent data with empathy, showing uncertainty and imperfection? How do we make data visceral?