
Meet the Community! Daisy Chung, visual communicator and illustrator
Daisy Chung is an award-winning science visual communicator and illustrator based in California and originally from Taiwan.
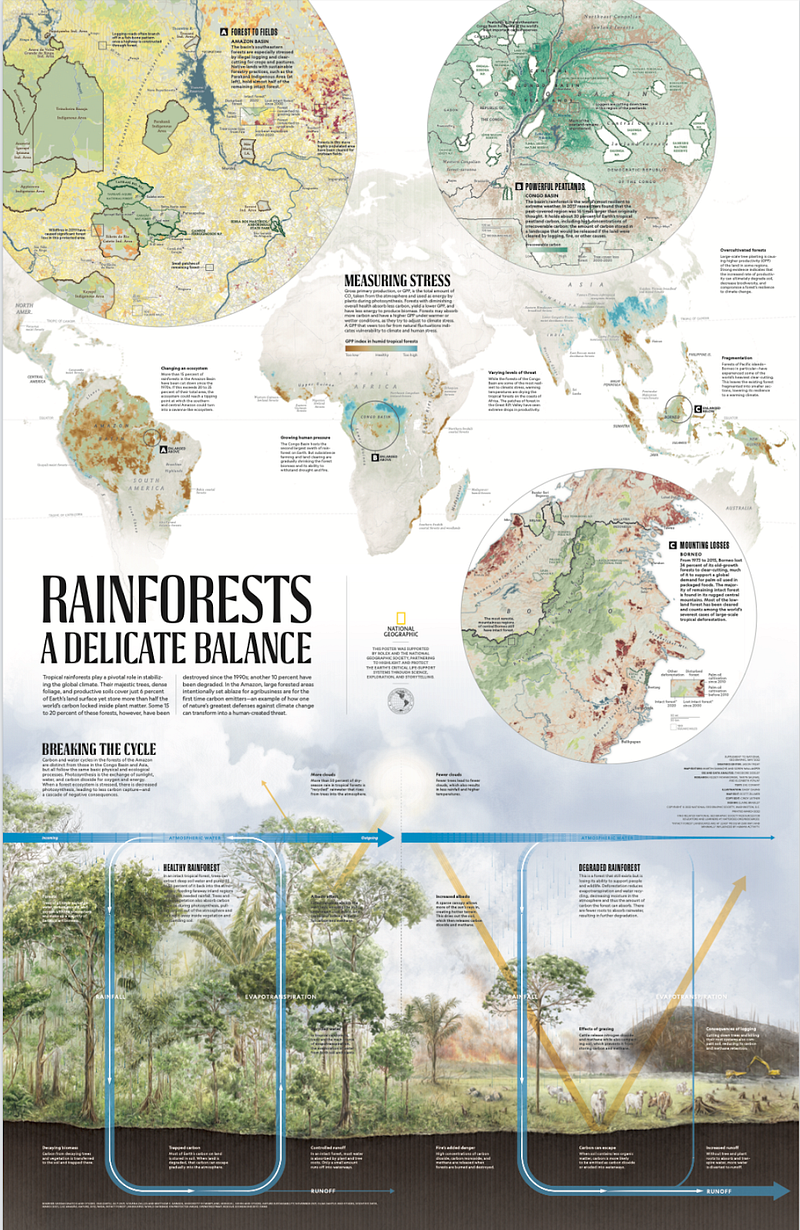
Daisy Chung is an award-winning science visual communicator and illustrator originally from Taiwan and New Zealand. Currently based in Sunnyvale, California, Daisy creates data and infographic designs to communicate complex science, with a focus on environmental and biological topics. Previously, she was the Data Visual Designer at Surgo Ventures, creating data-driven visual stories addressing global health and social issues. She was also formerly the Creative Director at wikiHow and Graphics Editor at National Geographic. In 2020, she co-initiated Taiwan Data Stories with data viz developer Julia Janicki, where they use multimedia to engage the global audience with Taiwan culture.
What’s your background and why did you start your career in scientific illustrations?
I’m originally from Taiwan but spent most of my childhood in New Zealand where I was always surrounded by nature. It was really an environment that celebrates creativity and curiosity, so that started my passion about science and figuring out how nature works. While I’ve always enjoyed drawing as a hobby growing up, I didn’t have technical training and never thought about pursuing it as a full-time career. But through my studies, I’ve always been really drawn to textbook illustrations and the clarity that illustrations can bring in explaining complex information. At college, I thought of trying something I both enjoy and am good at, so I’d ask my biology professors to let me illustrate their educational tutorials or visualise figures in their scientific papers.
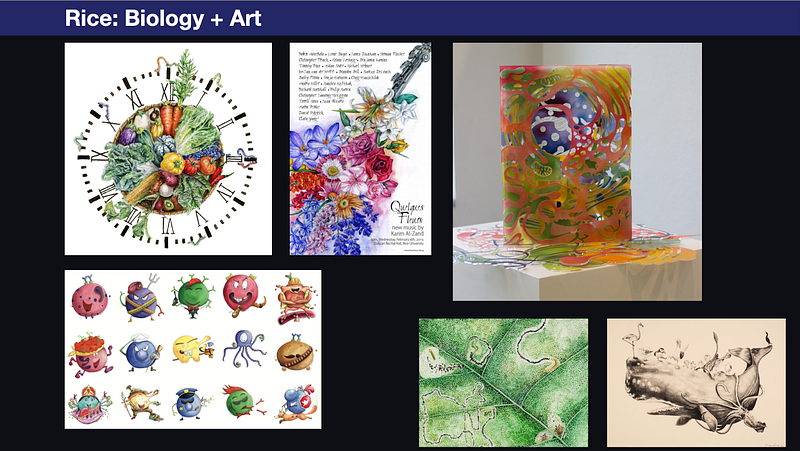
I graduated with a double major in biology and art at Rice University in Houston, Texas. At that point, I was still considering academic research. I loved wet labs, but I realised I wasn’t really good at it — I was much better at visualising things and was more intrigued about that. I was frustrated whenever I felt that scientists didn’t communicate to the public, or when the public didn’t seem to care or think that something was important. So I decided to pivot my career to focus more on science communication through visuals.
I did question this career path, as there wasn’t anyone within my community who’d done it, but I went to a science illustrators’ conference and saw people who could sustain their lives on this, and also loved their job so much.
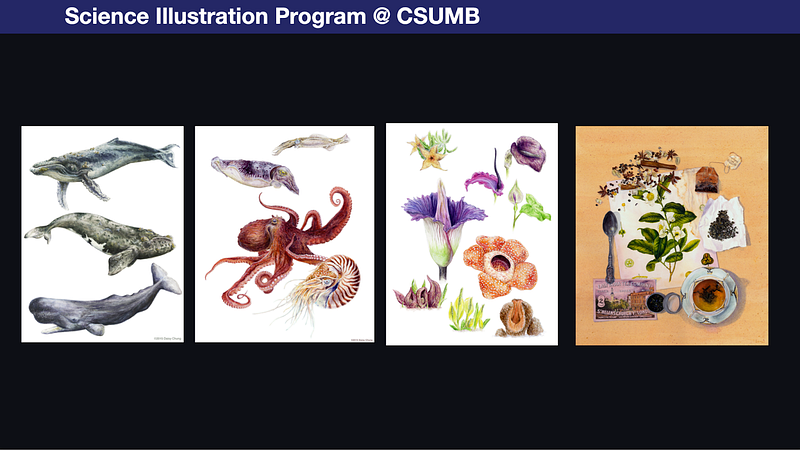
I enrolled in the graduate programme of science illustration at California State University, Monterey Bay; it only had 15 students, and it taught us amazing technical skills. I then realised that for more impactful storytelling, one needs to combine science illustration with writing and design, so I sought internships in Scientific American and National Geographic to learn how to fold art into design and communication. And then I just never looked back. I find it fulfilling how you can really spark people’s interest with your art on something that they initially didn’t care about.
What did you learn from each of your experiences at Scientific American, National Geographic, wikiHow, then Surgo Ventures?
Scientific American and Nat Geo set the foundation for me in terms of doing visual journalism and good storytelling. Being primarily in print, these publications taught me how to execute things to perfection, since you only get one chance to get it right. And I also learnt to collaborate with people like photographers, writers, and designers.
I switched to working at wikiHow to explore what it’s like working in a more digital-first environment and for a totally different audience. I actually emailed the CEO of wikiHow to make a case of why I thought they needed a creative director because I saw lots of potential to improve their visuals. They started me with a part-time contract because they were skeptical.
It was very humbling, because I came in wanting to professionalise the visuals but I realised the target audience — a younger, web-based one — really resonated with its existing style. So then I decided to really understand what types of illustrations work for the community, and help to better convey the information in an article, as opposed to changing the style. I also did more UI/UX design which I hadn’t previously experienced and worked with developers to redesign pages.
Meanwhile, I’d been freelancing part-time and got more interested in using data viz and wanted to do that professionally. I joined as Data Viz Designer at Surgo Ventures because I’d always wanted to try working in a non-profit space, and that was a great opportunity for me to both expand my data viz skills, and learn how to use data analysis and design for a very different audience to drive impact.
How would you differentiate between data visualisation and scientific illustration?
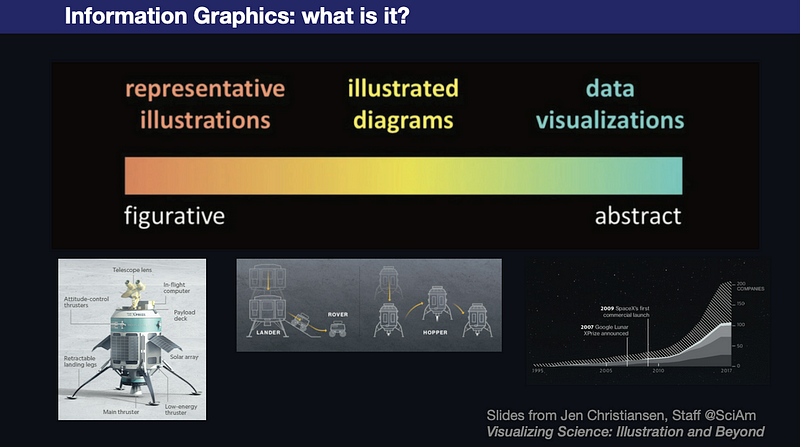
My mentor Jen Christiansen explained that illustration and data viz really exist on a spectrum — there aren’t really clear lines between them. On one end you might have more realistic representative illustrations, then illustrated diagrams which are more abstract, then data viz-like bars and charts. But illustration can also be the output of data. So I’d let the point of the story dictate the format.
How would you describe your creative process and visual style?
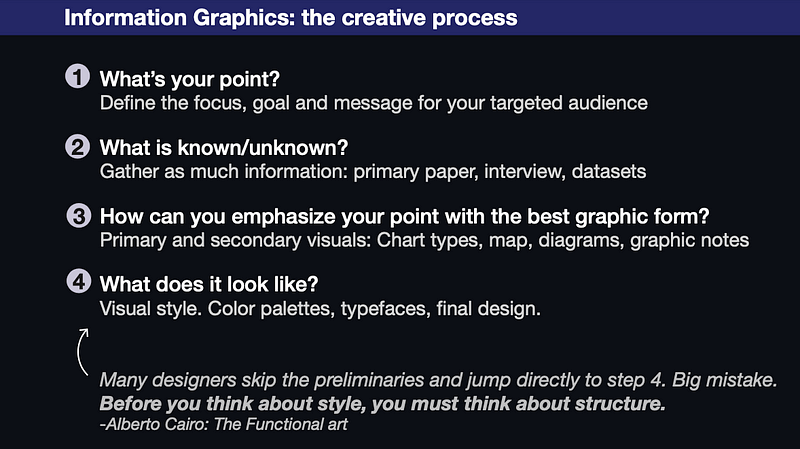
Style comes at the very end. Whenever I approach a project, I first think: what is the point of the graphic, and what is the story that I want to tell? I research to gather information about the subject in a way that’d be beneficial for my audience, then distil the most important versus the secondary information.
After that, I’ll start sketching and figuring out what graphic form — charts, maps, illustrations — will best serve my primary and secondary elements. And then I think about colours and typefaces.
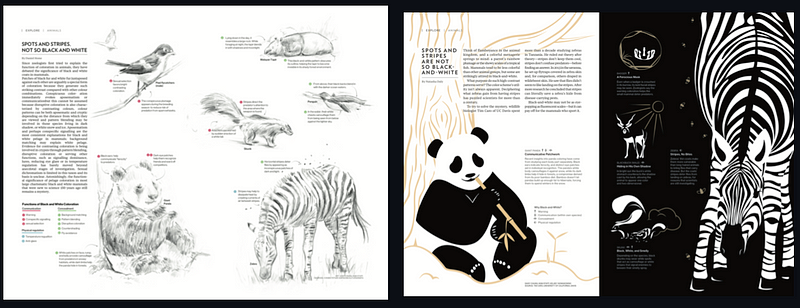
Another example would be this Black And White Animals piece in Nat Geo. To immediately engage the audience, I opted for a more stylistic approach so the images are very vectorised, which the expert researcher didn’t like. But I know my audience are not experts, they’re the general public, and they really engaged with it. So before you think about the style, think about the structure and always go back to: what is the point of this graphic? What kind of audience and purpose do I want to serve for this type of illustration?
How do you know who likes what?
I really appreciate the feedback process, which helps me decide the kind of work that’ll resonate with my audience. It’s not always intuitive in the beginning. Thinking about the audience and being in their shoes is the most important. I would make sure throughout the whole process to proactively seek feedback from the graphics people, but also from those completely outside the graphics sphere, like my mom and my husband, to see if they really resonate with the graphics. That may depend on the subject type. Like with Taiwan Data Stories, I knew that culturally, the audience would resonate more with cute illustration styles. I look at what the audience is engaging with, and that informs the kind of style I would do.
I’m curious, how do you know how much information should be communicated by explaining to the audience, versus being explorable by the audience?
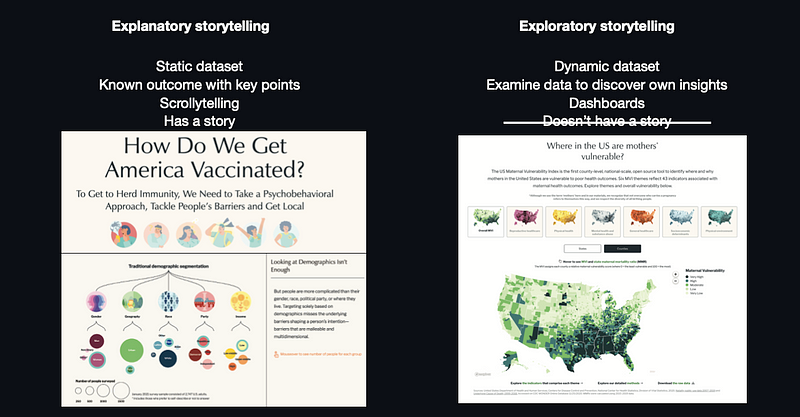
When exploring a data set that is still very fluid, it can be frustrating because there may not be ready insights from the data, and I may not feel confident about telling a story based on that data. But I learnt you can still tell a story. With the maternal vulnerability project which I worked on at Surgo, the dashboard is exploratory, but you still need to provide context and break the issue down, like explain why mothers in the US are more vulnerable, the impact of racism, and then why this issue matters. So you can still have a point to make in exploratory data stories.
How did the Taiwan Data Stories idea start and how has it developed ever since?
My interest in data viz brought me to the Outlier conference in 2021. During that conference, thanks to Kontinentalist, it opened my eyes to how lacking Asian voices are in the data viz and media space. I connected with creatives outside of the US and reflected on the projects they’ve done, and the fact that I’m from Taiwan and never did any stories about it. I’m still always approaching these stories from a more Western lens, even though I have such a different upbringing. That was when I met Julia, who’s a fellow Taiwanese and data viz developer, and we shared the same thoughts. So we talked about utilising our expertise to bring data viz to Taiwan, as this format is still very new, and share stories about Taiwan that can get lost in translation in a Western-dominated media landscape.
Most of the stories you hear about Taiwan are political, but there’s so much more to share. This side project allowed us to have fun, experiment, build skills and community. It’s pretty amazing — now we have 12 people who share the same motivations contributing to our community! (Hear more about our collaboration journey here, and follow us on Instagram for updates.)
What were the kind of creative or technical challenges that presented themselves here and how did you address them?
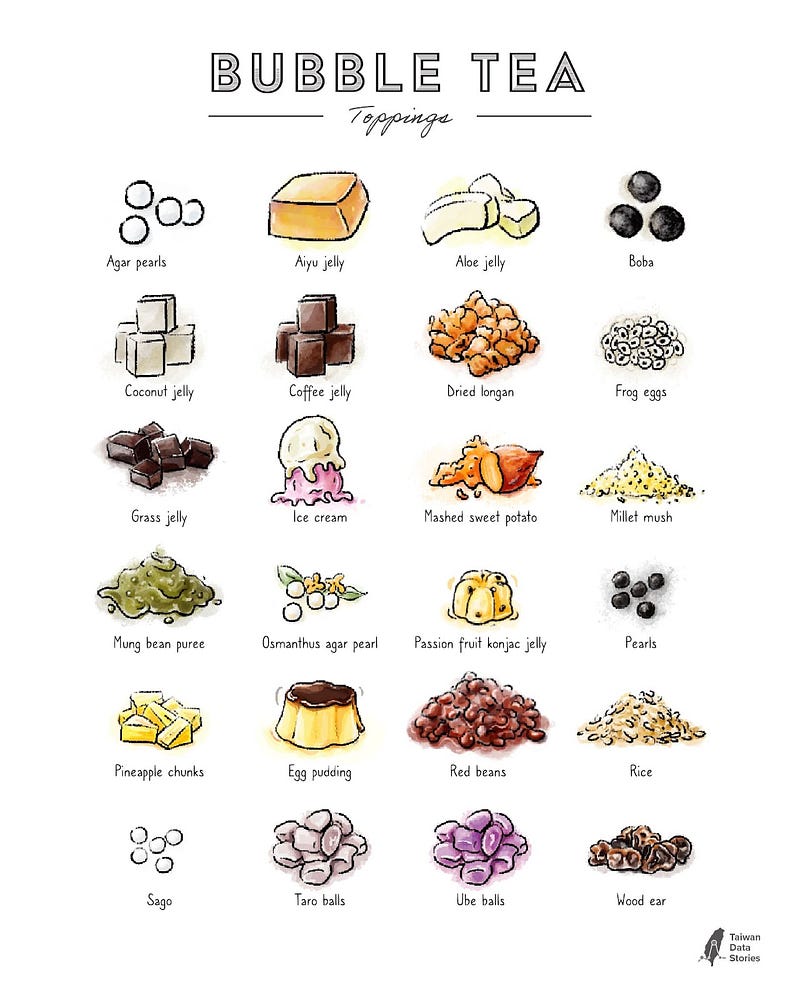
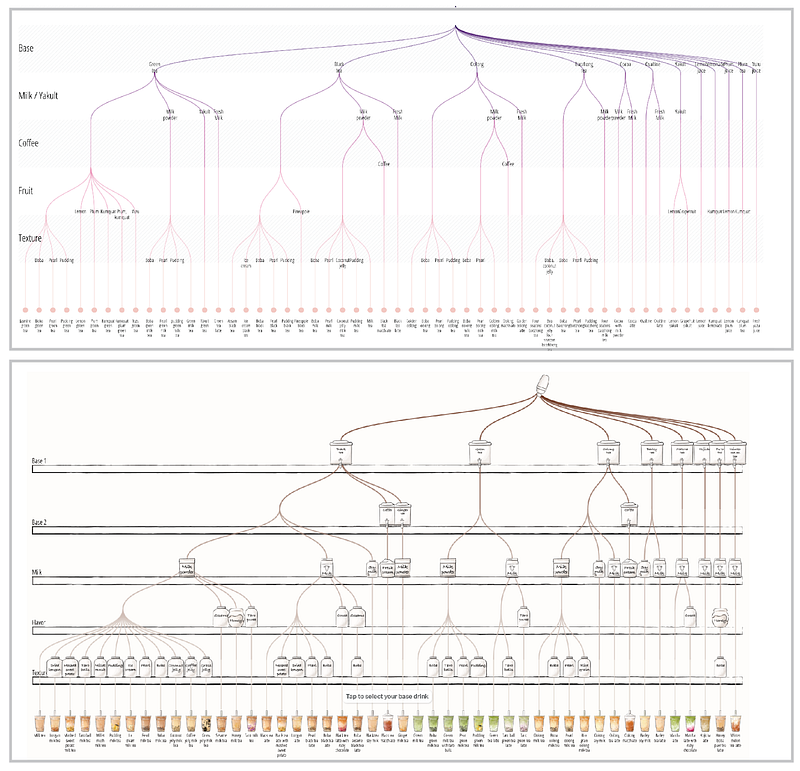
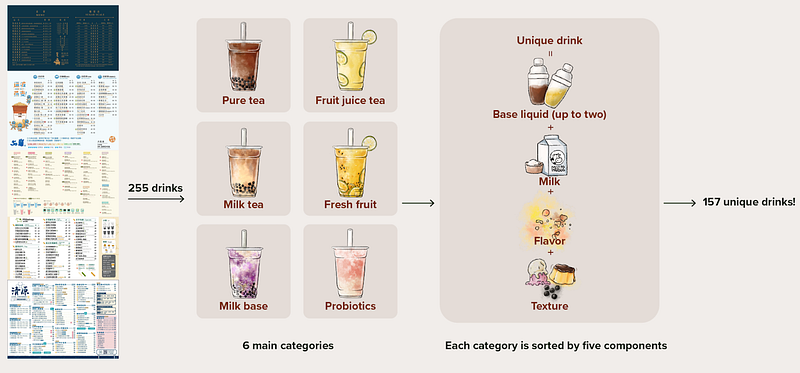
We chose bubble tea for our story because it’s such a charismatic and representative drink of Taiwan, and we wanted to invite people outside the data viz space to experience this. There was lots of possible data to collect about this topic, like their trajectory of growth and how popular it’s become. We realised what was the most unique thing for someone growing up in Taiwan is how many different types of combinations you can have.
One day Julia showed me the boba hierarchy tree, and it inspired me — I immediately saw the curvy lines as flows of tea ingredients all cascading and colliding into the final product.
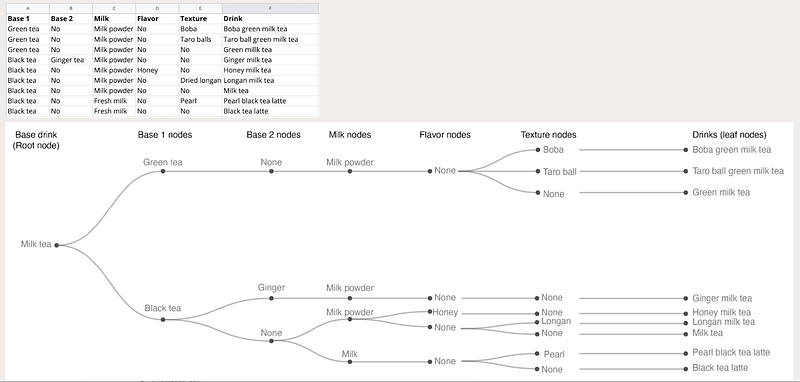
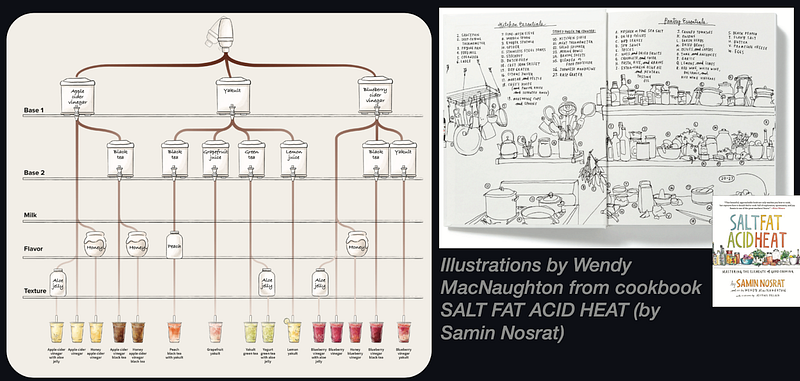
I was also inspired by Wendy MacNaughton’s illustrations of kitchen shelves in the book Salt Fat Acid Heat, and integrated boba store equipment for each node, to show the mixing experience.
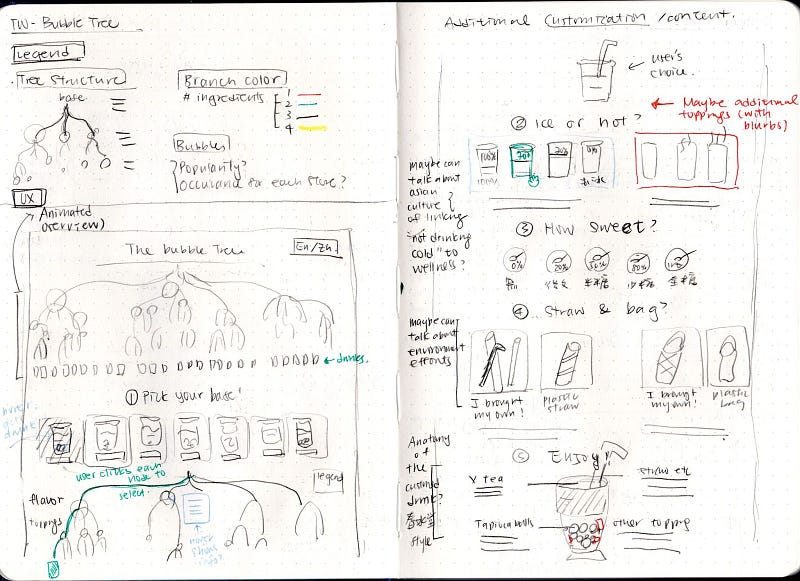
In terms of the narrative design, we had to figure out how we could fold our culture into the story — for example, the step-by-step drink ordering experience, the different cultural affinities with preferences of hot versus cold drinks, and even environmental policies. We learned a lot about Taiwan during this process, because we’ve both been away for so long.
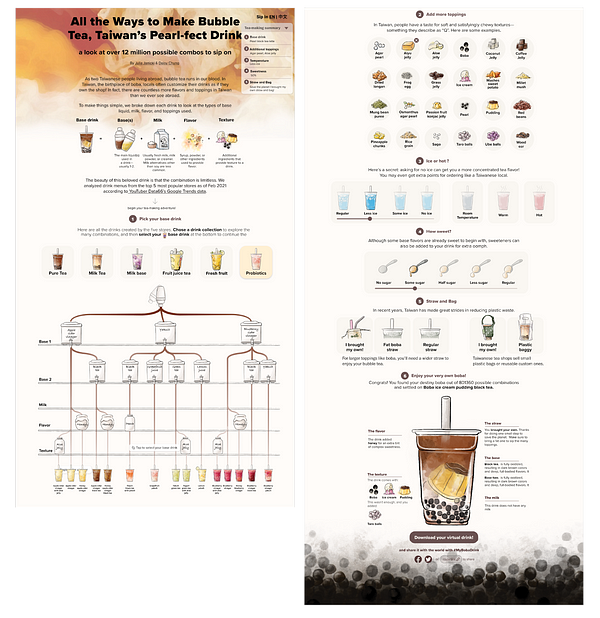
You classified bubble tea in a way that was still logical. A big challenge in data storytelling is classifying the data in a defensible way.
Figuring out the categories was really challenging. We picked the top five most popular bubble tea stores in Taiwan to get the data, but the stores all categorise their drinks in very different ways. Like, how do we define milk tea versus tea with milk powder versus tea with fresh milk? We cleaned the data for the five stores, and then tried to find the most unique combinations that would work across all of them. This project was very technically challenging; we still haven’t figured out how to make it mobile-friendly.
I fell in love with data-driven storytelling because it’s got both the beauty and the challenges.
The data really shapes your story, but it’s also challenging because it’s not until you put in a data point and see what that format looks like that you’d know if it works, or what’s the main point you’re trying to make. So you have to iterate to find what’s the best graphic form that would work, and you need to clean up your data. Working with Surgo where I worked with data scientists, I found science illustration a lot clearer, whereas with data it all starts with mud. It makes Step 2 (gathering information) and Step 3 (finding the best graphic forms) of the creative process longer because you need more exploration.
This also made me realise how mindful we need to be when working with data, because I realised when you’re trying to clean data, you’re trying to figure out what to focus on. Many times when you create a data-driven graphic, the audience will think it’s very objective and fact-based. But in all honesty, it’s still people picking the data and deciding what is going to be amplified. A lot of unconscious biases can fold into that. I don’t know if I’ve totally figured out a clear solution, but I’ve definitely become a lot more mindful about it during my process.
How have you managed that balance of learning new stuff, but also deepening your existing abilities?
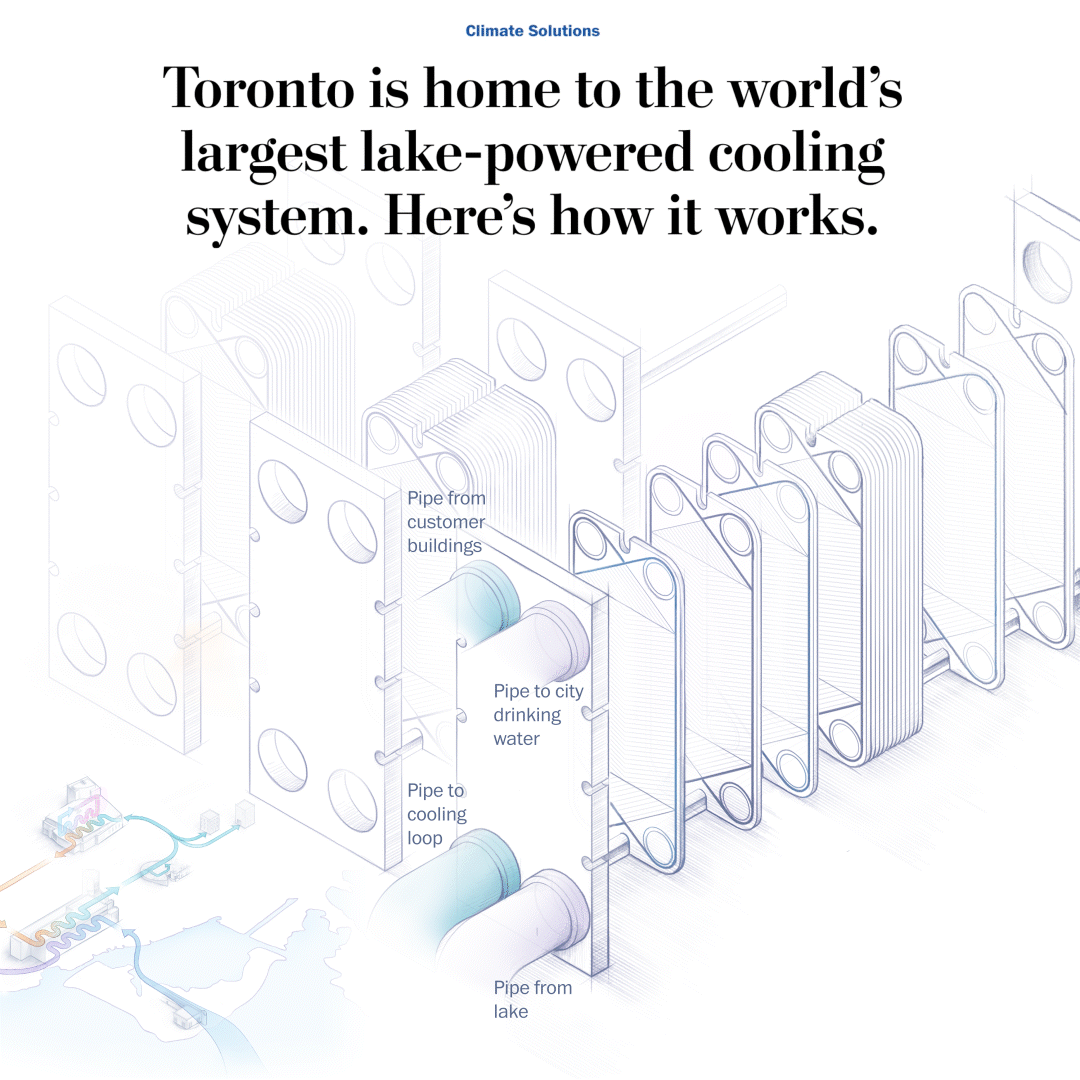
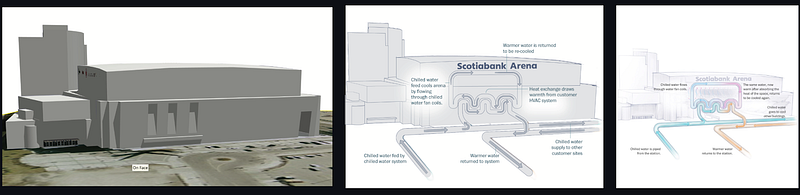
Everyone in a creative role thinks about that. My approach to learning new skills is to try to fold in a new approach/technology/technique for each project, and see each skill as a way to expand my toolbox that I can then fluidly tap on for new projects. For example, in a story about Toronto’s lake-powered cooling system, I learnt to work with 3D models, which I hadn’t used before.
When I’m mentoring students, I realise people are so overwhelmed by the many new things to learn. But it’s really important to know that you’re not supposed to know it all. That’s why there’s all these people with various different talents and why we collaborate with them. I’m still not great at developing and that’s why I collaborate with Julia, who has amazing skills. So while you’re continuing to learn, don’t overwhelm yourself. Focus on where you really want to grow and enjoy the most and seek to work with other people with complementary skills. Start small on what really motivates and excites you, then slowly build on that and experiment through your projects. It’s through working on projects, either professionally or passion ones, that I learned what I enjoyed the most.
What are your insights about the data viz and storytelling field in the US or Asia or Taiwan, and what are your hopes for it?
I feel like the current US media space is keen to involve more diverse stories, but it’s still quite dominated by the Western perspective. There are efforts to recruit more diverse global teams, and now that we can all work remotely that brings in new opportunities. But I still feel like the story content itself is kind of monolithic, like everyone’s kind of telling the same story with similar perspectives. It’s important for newsrooms and media to not only build a diverse team, but also uplift diverse perspectives within the creative process. Like in tackling the same topic, how do we actually think about a different way of approaching and explaining it?
For example, there was a story I contributed to about Chinese medicine where the entire story team was very focused on making comparisons to Western medicine and how we couldn’t share certain elements because it’s not factual or evidence-based. There’s so much legacy and knowledge behind traditional medicine that you wouldn’t even think about questioning it if you were reporting on the story in Asia. It was quite a challenge to advocate for a graphic piece to be presented. That was one experience where I realised that even to this day it is hard to break through that default thinking from a Western perspective when we are so used to such an environment in the media landscape.
It’s not perfect, and I’m not perfect too in that sense, because I also default to those lenses sometimes. That’s something I feel definitely has room to grow. It will be really exciting to see how that expands outside of the US.