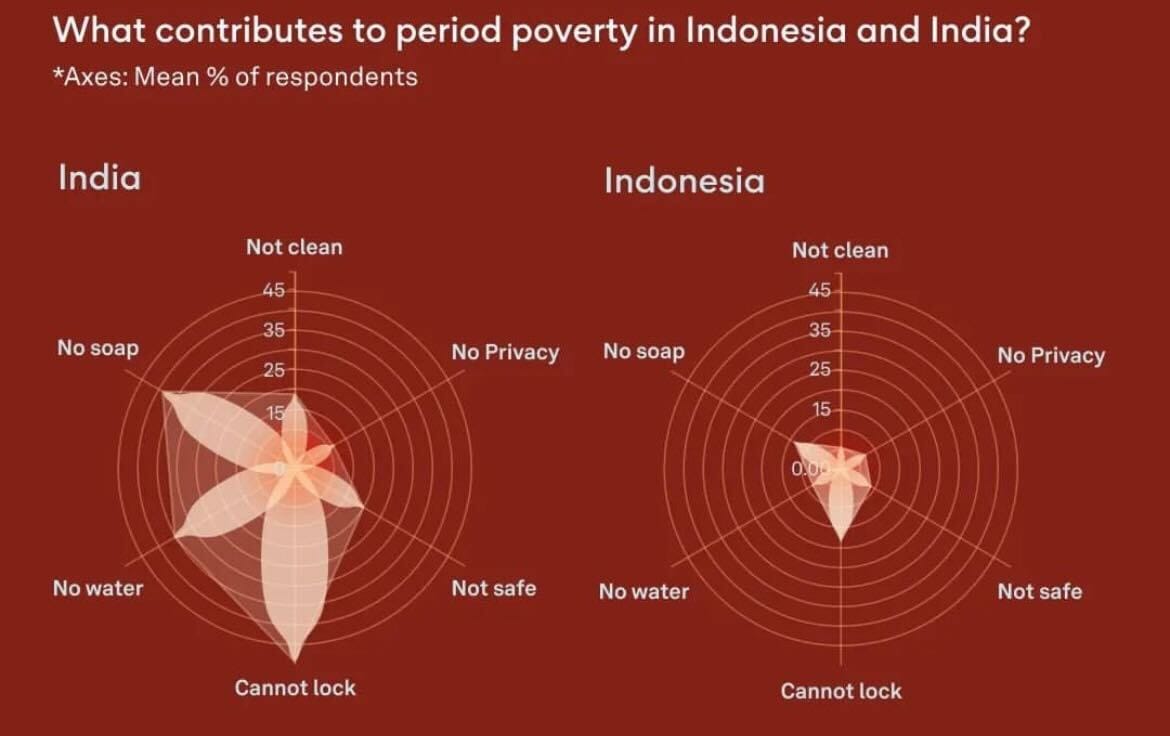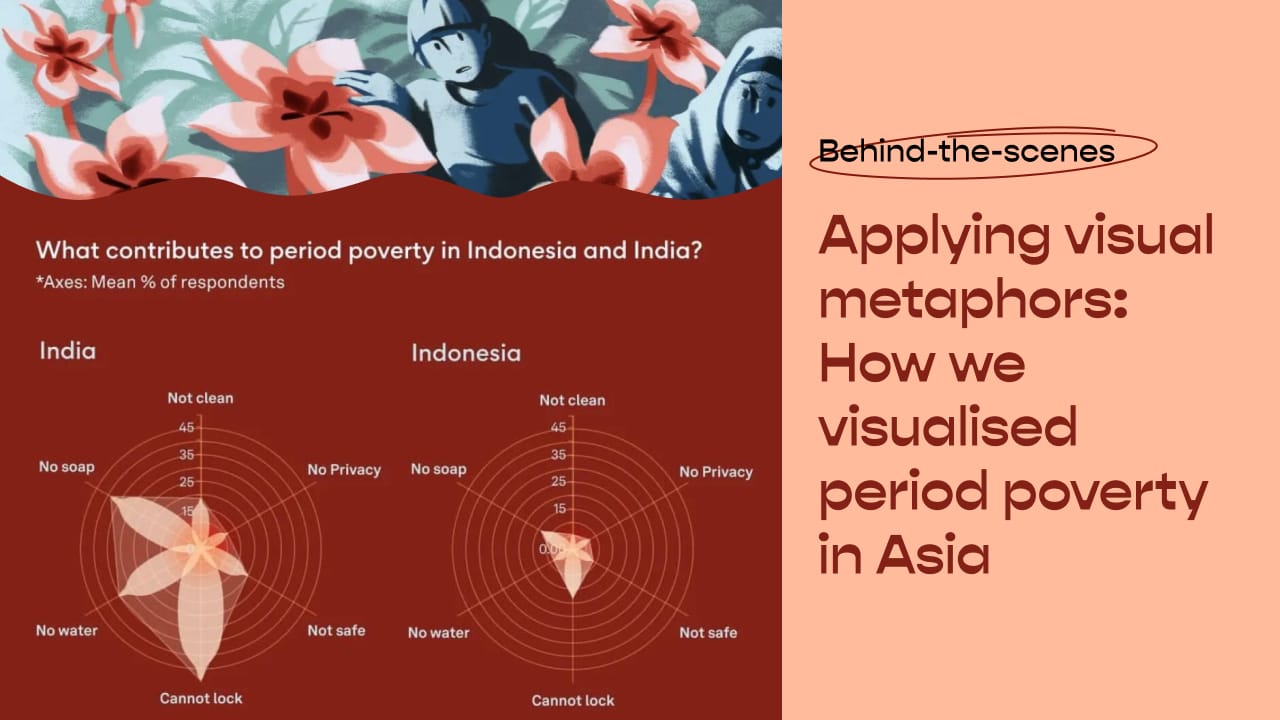
Applying visual metaphors: How we visualised period poverty in Asia
This microstory came about when Singaporean period care company Blood launched its “Period-Positive Workplaces” movement in 2022. A communications agency had sent over a press release of the initiative, which included survey findings on period shaming at work. Having never experienced bullying or pressure of any kind related to my periods, I was shocked to find out that close to three in four women in Singapore had experienced some form of period shaming in the workplace, either through bullying, isolation, or “time of the month” jokes. It was not something I had thought much about, so I gladly took the opportunity to meet with the Blood team and discuss how we could collaborate.
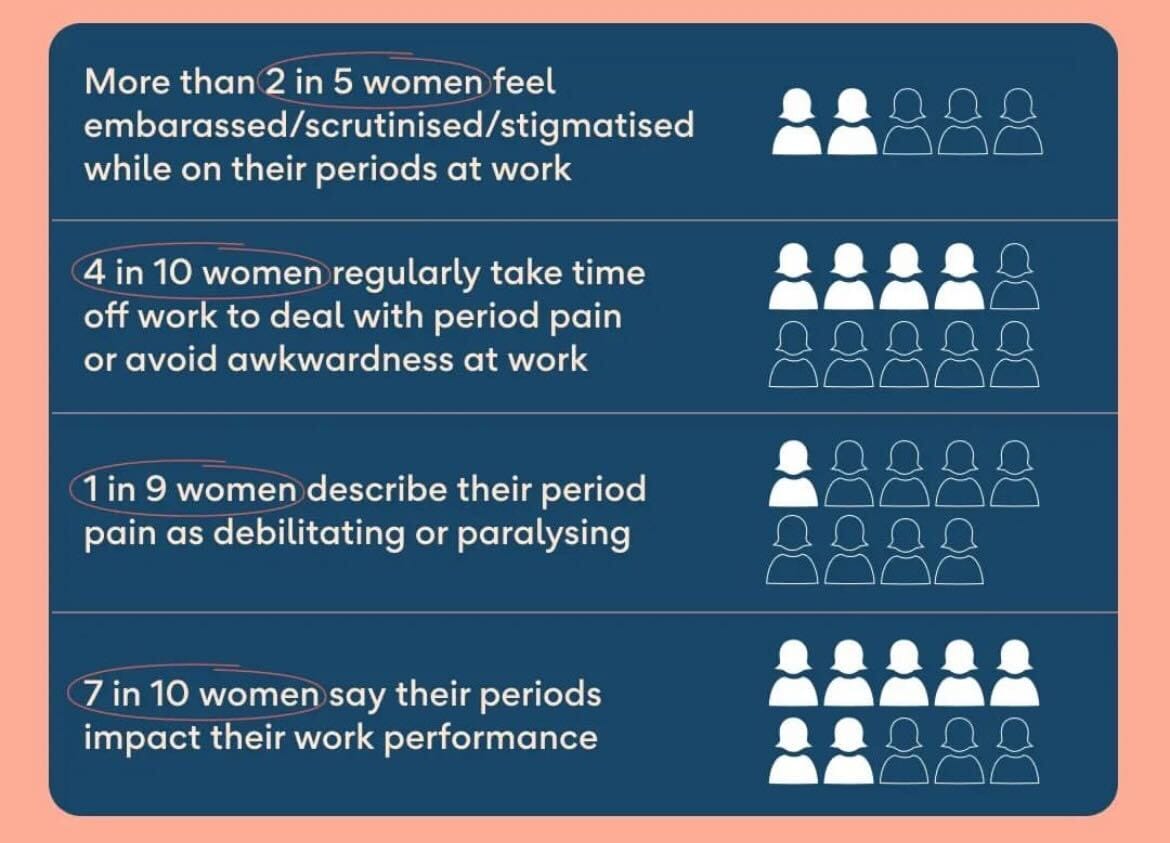
At the time, I was part of a data viz study group with my colleagues Griselda, Aishah, and Bianchi. We were loosely working on data viz challenges and reading up on resources from the Elevate data viz learning community, as well as looking out for a project to apply what we had learned. Since the topic was interesting to all of us and Blood’s data was pretty straightforward, we decided to collaborate with them and publish a data viz-heavy microstory on periods for International Women’s Day.
After some discussion, we realised we wanted to extend the conversation beyond Singapore and talk about women’s experiences through a more intersectional lens. What barriers to menstrual hygiene do women from different socio-economic classes and cultures face? More research led us to a study about socio-economic inequalities in menstrual hygiene in low to middle-income countries. Although it took a while for us to understand the methodology behind the data, we found it reliable and promising, considering the dearth of data the study had regarding menstrual health practices on national and regional levels.
